Live Update

Tuesday, September 30, 2008

09/30/2008 Market Recap: Major Accumulation Day

1.0.5 Major Accumulation/Distribution Days.  Surprisingly today is a Major Accumulation Day.  Concerning major accumulation day, a single day does not have significant meaning, what is important is the second one, so called Follow-through Major Accumulation Day.  Today is the first one.  Sep 18th is almost a major accumulation day, so today might be considered as the second one.

The theory of the major accumulation day is:

  1. Double major accumulation days predict a strong rally over the intermediate term.  The historical data is in chart 8.2.0 Major Accumulation Day 2007-2008 to chart 8.2.5 Major Accumulation Day 1997-1998, so far it is 100% correct.  A professor has studied this and here is the abstract:

    "David Aronson, a professor of finance at Baruch College looked at instances in the market (from 1942 to present) when we have these double 90-90 days. His time frame for the second is much wider than what we just witnessed - 3 months. But the results are intriguing nonetheless.
  2. After the special circumstance of a double 90-90 day, the following 60 (trading) days have historically provided a return of +22% instead of a paltry 4.5% annualized otherwise. It is more remarkable when you consider that that return comes with the assumption that you enter the market on the close, after a double 9-to-1 signal was triggered and without adding any dividends!"

  3. The reason why Sep 18th may be the first major accumulation day can be referred to 8.2.4 Major Accumulation Day 1999-2000 and 8.2.5 Major Accumulation Day 1997-1998, where one of two major accumulation days does not meet the criteria strictly.  Therefore, very likely today is a follow-through major accumulation day.  On the other hand, I am not very sure about this, especially before the bailout plan is confirmed to be approved, I don't think the market would have a significant rally.
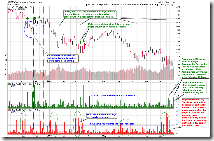
  4. If today is the first major accumulation, be cautious to do the bottom fishing.  On the following chart, the blue comment shows the reason, i.e., it's possible to see a massive selling off, and yesterday may not be the bottom.
    1

OK.  What about the near term, for instance, tomorrow?  Well, probably a pullback is due.

1.1.5 PowerShares QQQ Trust (QQQQ 15 min), 1.0.4 S&P 500 SPDRs (SPY 15 min).  The pattern looks like a bearish rising wedge, and the Fib 50 is tested back.  Therefore, be cautious.

2

1.3.7 Russell 3000 Dominant Price-Volume Relationships.  This is the primary concern today, up on decreased volume, 1391 stocks price up volume down, which is the most bearish one among four price-volume relationships.  According to my statistics, very likely the market will pull back tomorrow or the next day.

3

3.1.0 US Dollar Index (Daily), US dollar is overbought and it has rallied for seven days.  So far the historical record is seven days of rally in July.  Therefore US dollar may pullback, which is bearish to the stock market.

4

1.1.7 TRINQ Trading Setup, TRINQ is below 0.6 today.  According to this setup QQQQ will drop down tomorrow.  The success rate is now 79%.

Of course I don't think this potential pullback can go very far (I said the same in the last week report, and INDU plunged for 777 points yesterday.  Hopefully it doesn't happen again).  The reason is that both NYA50R and RHNYA are still oversold on the chart 2.4.3 Breadth Oversold/Overbought Watch.

5

1.4.2 S&P/TSX Composite Index (60 min).  TSX is right at the resistance on Canadian market.  Tomorrow it might pull back as well.

6

Monday, September 29, 2008

09/29/2008 Market Recap: Don't bet on the end of the world

I must admit that my prediction was wrong, the market does care the deal.  Although the market is extremely oversold, I am not sure if this means the market would bounce back tomorrow.  Under the current situation, it doesn't make much sense to say "stay clam" ... "stay defensive", etc.  Everyone should have a plan in their mind, what to do if the market bounces back, and what else to do if the selling off continues.  At the moment my long positions are not very heavy, and I also think that a oversold market could have a chance to bounce back, therefore I decide to hold my positions.  Depending on how the market goes I will think about whether or not to do bottom fishing, but I will not be aggressive for sure.

During the trading hours a friend said -- Don't bet on the end of the world -- I think it makes sense at the time being.

From the perspective of technical analysis, the market is deeply oversold.  I do not know if you still believe in the oversold indicators, but I list them as follows anyway.  Probably it is the time to believe in the government.

2.4.3 Breadth Oversold/Overbought Watch.  RHNYA is almost zero, extremely oversold.  NYA50R is also oversold.  Although it has not reached the July low, it will probably get there after one more day's selling off.

1

1.3.7 Russell 3000 Dominant Price-Volume Relationships.  The dominant price-volume relationships today are 2183 stocks price down volume up, which indicates the market is oversold.  According to the chart, every time after the price down volume up, the market bounces up nicely on the next day.  Hopefully tomorrow is not an exception.

2

2.0.0 Volatility Index (Daily).  Several indicators are overbought.  On the other hand, this chart reveals that today's low may not be the bottom.  As I mentioned in the past, usually the bottom is formed as an intraday reversal, so the market is not likely bottomed out while the VIX is still a big while candle.

3

1.1.6 QQQQ Short-term Trading Signals.  Note that in the past NAADV bounced back while the blue line reaches today's level twice.

4

1.1.7 TRINQ Trading Setup.  TRINQ is much higher than 2.0, so QQQQ might bounce back.  So far the success rate of this setup is 75%.

1.0.3 S&P 500 SPDRs (SPY 60 min), 1.1.4 PowerShares QQQ Trust (QQQQ 60 min), 1.2.3 Diamonds (DIA 60 min).  Look at how oversold the RSI is.  If you think it is not oversold enough, it will be after one more down.

5

1.4.4 TSE McClellan Oscillator.  New low spikes on the Canadian market, which is an early sign of bottoming.  1.4.2 S&P/TSX Composite Index (60 min), RSI on the 60-min chart is also oversold.  By the way, on US market the new low spikes as well (refer to 2.4.4 NYSE McClellan Oscillator), however it doesn't go beyond the level on 17th so I don't show it here.

6

1.0.6 S&P 500 Bullish Percent Index.  Today it gives a mid-term sell signal, and the signal are confirmed by all three major indices, very bearish.  0.0.0 Signal Watch and Daily Highlights shows the status of all signals.  No comments at the moment, wait for the smoke to clear firstly.

7

Saturday, September 27, 2008

09/26/2008 Market Recap: Encouraging

0.0.2 SPY Short-term Trading Signals.  With so many bad news on Friday, it would not be a surprise to me if INDU dropped down 500 points.  Surprisingly SPX held the Wednesday low, which is quite encouraging.  I do not know whether or not the bailout deal can be reached by Monday, but it seems the market is ready to rally according to the chart.  In the short term, because the breadth is still oversold, I doubt how big the downside space is even if there was no deal.

1

2.4.3 Breadth Oversold/Overbought Watch.  The three important indicators for watching breadth oversold/overbought are put on the same chart as follows.  It can be seen that RHNYA is deeply oversold, and the other two are also very close to the oversold region and show positive divergence as well.  This is the primary evidence that I don't think the market has a big downside space.

2

2.0.1 Volatility Index (Weekly).  VIX has rallied for five weeks for the first time in the history.  In the next week it is very likely that VIX will drop down, which will be bullish for the stock market.

3

0.0.3 SPY Mid-term Trading Signals.  Note that the positive divergence of MACD and RSI is very similar with the setup in March.  Considered the current level of VIX:VXV, the market will very possibly have a terrific rally over the intermediate term just like the one from March to May.

4 

As a summary, the intermediate term trend is bullish.

1.4.4 TSE McClellan Oscillator.  On the Canadian market, both RHTSX and TSXA50R are oversold, and I think the market might bounce back.

5

1.4.3 S&P/TSX Composite Index (15 min).  The pattern looks like an Ascending Triangle, and the probability of upside breakout is relatively high.

6

3.1.0 US Dollar Index (Daily).  US dollar may form a bear flag and thus may resume dropping soon.  The correction of US dollar is a good news for commodities, and also favors a bullish Canadian market.  By the way, 3.2.1 Japanese Yen (Weekly), Bearish Harami, and I think Japanese Yen will possibly pull back, and this may offset the pullback of US dollar as well as its negative influence to the stock market.

7

3.3.2 streetTRACKS Gold Trust Shares (GLD 60 min), Ascending Triangle.  If US dollar goes down, GLD may rally again.

8

3.4.3 United States Oil Fund, LP (USO 60 min), Symmetrical Triangle.  The rising of oil may be continued.

As a summary, Canadian market will probably turn bullish, so will the commodities.

Thursday, September 25, 2008

09/25/2008 Market Recap: No Title

No much to talk about today -- everyone is waiting for the outcome of 700B bailout plan.  I don't know what will happen tomorrow, but it seems nothing concrete will be released before the weekend.  Maybe the market will be disappointed tomorrow.  But I guess the bailout plan will be passed anyway, and it would be a good news according to the market reaction today.

From the perspective of the technical analysis, we need an up day tomorrow, otherwise 1.0.6 S&P 500 Bullish Percent Index may give a confirmed sell signal soon.

1

The only good news for bulls is that RHNYA at the bottom of 0.0.2 SPY Short-term Trading Signals chart is still oversold.

2

1.1.7 TRINQ Trading Setup.  TRINQ closed below 0.6 today so tomorrow QQQQ may drop down.  So far the success rate of this setup is 71%.

2.8.1 CBOE Options Total Put/Call Ratio.   CPC is only 0.8 which is over bullish.  However, normalized put/call ratio at the bottom of the chart is still in the bullish region so it seems okay at the moment.

3

1.4.3 S&P/TSX Composite Index (15 min).  Canadian market looks slightly better.  Bullish falling wedge, and positive divergence on both MACD and RSI.

4

Wednesday, September 24, 2008

09/24/2008 Market Recap: No Buy on Rumor then no Sell on News?

Firstly I would like to tell you that in the past few days it has been really difficult to analyze this news-driven market.  So don't blame me too much if the success rate is low or the report is biased a bit.

From the perspective of the technical analysis, the market has been accumulating the upward momentum for a while.  I believe that, the market will very likely rally once the Bailout Plan is approved.  Furthermore, all indicators on 0.0.1 Market Top/Bottomed Watch have given buy signals, which is really rare to see in the past, and it is not very likely that all signals are wrong.  Moreover, 0.0.3 SPY Mid-term Trading Signals has two valid mid-term buy signals.  Therefore, at the moment I tend to bet on the long side.

A reader raised a question to the judgement of market bottom over the intermediate term.  I think this question makes some sense, so I put it here fore your information.  Personally I think the reliability of those signals that mentioned by the reader is slightly lower than five signals in 0.0.1, so I make my judgement based on chart 0.0.1.  Nevertheless, I could be wrong, and you have do your own due diligence prior to any actions.

You mention about intermediate term buy signal. However, I believe there are also some charts which are still bearish (i.e. charts that say Bottom not in yet). Wonder why the bullish bias is preferred?

For example, T2101 brown curve needs to go down for some time before bottom - is it down yet?

(Cobra: here is the T2101 today)

1

SPY drop 3 days in a row - not happening yet?
McClellan Oscillator (2.2.1) - No positive divergence yet?
NYSE advancing issue (2.4.2) - normally a series of lows, now only 1st low?
Nasdaq Total Volume/NYSE Total Volume (2.3.4) - now above "high" level again?
With above, wonder if it is possible short or medium term bullish?

Concerning whether or not the bailout plan will be approved, and whether the amount of fund will be kept as 700B finally, here is my two cents but you don't take it too serious.  You may have noticed that the market behaved differently than what it did in the past.  Previously if the congress was arguing an act, the market would rally in advance with the rumor and last (note: the trend really lasts continuously) until the last moment when the act was approved.  However, the market is dropping down without significant bounce.  As a result, if the market was typical buy on rumor, sell on news in the past, will it not sell on news since there is no buy on rumor this time?  Does it mean that the market is betting that the bailout plan will be approved with satisfaction?

0.0.2 SPY Short-term Trading Signals.  Although SPY went up today, actually both SPX and NYA dropped down.  Because of the increase of advancing issues (relative to the down of NYA), NYAD can be considered as positive divergence.  In addition RHNYA is still oversold.  So the market may likely bounce back in the short term.

2

1.0.4 S&P 500 SPDRs (SPY 15 min), 1.1.5 PowerShares QQQ Trust (QQQQ 15 min), 1.2.7 Diamonds (DIA 15 min), 1.3.6 Russell 2000 iShares (IWM 15 min).  On the 15-min charts of all major indices, MACD and RSI show positive divergence which means the downward momentum is weakened.  Of course the pattern on the charts also looks like a Descending Triangle.  So I am not sure if the market will break the descending triangle and drop down.  A possible scenario is that, in the morning the market may break downward and then bounce back afterward, finally we may see a small candle on the daily chart and wait for the news on the next day.

3

1.1.7 TRINQ Trading Setup.  TRINQ is lower than 0.6, so QQQQ may drop down tomorrow according to this setup.  So far the success rate of this setup is 74%.

3 month T-Bill Yield went down again today.  This means the fund is getting nervous which is good and bad, because the major central banks in the world will probably do something should it drop further down.

4

Tuesday, September 23, 2008

09/23/2008 Market Recap: No Title

As you can see the market is somewhat emotional and driven by news.  From the perspective of the Technical Analysis, two buy signals in 0.0.3 SPY Mid-term Trading Signals are still valid, so I assume the trend is up over the intermediate term.  In the near term, the market may likely rally tomorrow.

0.0.2 SPY Short-term Trading Signals.  Here is the evidence for tomorrow's rally.  NYAD indicates that there are more Advancing issues today compare with yesterday, which is a positive divergence.  RHNYA at the bottom of the chart is oversold, which also support the rebound of the market.  In addition, VIX is overbought which is also bullish to the market.

1

1.1.5 PowerShares QQQ Trust (QQQQ 15 min), Bullish Falling Wedge, MACD, RSI positive divergence.

2

3.0.1 Yield Curve.  Today UST3M went down again, which means the short of fund.  This is bearish.

3

Monday, September 22, 2008

09/22/2008 Market Recap: No continuous down days ever?

Today the market pulled back as expected.  Although the selling-off is a bit massive, the mid-term buy signals are still valid.  However the trend could be changed if the market goes down tomorrow as much as today, then the last Thursday bottom could be tested.

Will the market go further down?  My conclusion is that a rebound is possible, and even if the pullback continues the magnitude will not be as huge as today.

The following chart shows the evidence for rebound.  Since September, there have been never two down days in a row.  If this pattern is continued to be valid, hopefully the selling-off will not appear tomorrow.  Furthermore, VIX at the bottom of the chart is still overbought which favors a rebound of the market.

1

1.0.4 S&P 500 SPDRs (SPY 15 min), 1.2.7 Diamonds (DIA 15 min).  The pattern on 15-min charts look like a Bullish Falling Wedge, which may possibly cause a rebound of the market.  In addition, RSI is oversold and at a level where the market usually does not plunge hard.

2

3.0.1 Yield Curve.  The yield is going up which means the things are getting better.

3

3.1.0 US Dollar Index (Daily).  US dollar is oversold and testing the Fib 50 and 50-day moving average.  If the drop stops here, the market could be improved.

4

3.4.3 United States Oil Fund, LP (USO 60 min).  Oil is overbought.

5

Sunday, September 21, 2008

09/19/2008 Market Recap: Good Follow-Through

In this weekend I reorganized the technical indicators in my chart-book and arranged the important ones on chart series numbered with 0.x.x.  If you are too busy to go through all the charts, just check out 0.x.x.

Conclusion:

  1. Over the intermediate term the market should have a decent upside room.
  2. It is unclear if the market goes up or down on Monday.  However we may see a pullback in the near term.

Mid-term signals:

0.0.3 SPY Mid-term Trading Signals.  There are two mid-term buy signals, where one of them BPSPX is confirmed and I will show you.  It is also encouraging that VIX:VXN is still in the buy zone, which means the market should have a decent upside room in the mid-term.

1

1.0.6 S&P 500 Bullish Percent Index.  All three major indices have confirmed the buy signal.  On this chart, once all three indices agree with each other, the success rate is very high.

2

2.3.3 NYSE Total Volume.  The market bottom pattern is quite convincing.

3

3.2.1 Japanese Yen (Weekly).  Black candle and Fib 50, very likely it will pull back, and this is bullish to the stock market.

4

1.4.4 TSE McClellan Oscillator.  Canadian market also gives a buy signal.  According to the golden candles, it seems the market has bottomed out.

5

Short-term signals:

0.0.2 SPY Short-term Trading Signals.  The breadth indicators are at relatively extreme range.  So we may see a pullback soon or later.

6

2.8.0 CBOE Options Equity Put/Call Ratio.  This is over bullish and isn't sustainable.

7 

1.0.3 S&P 500 SPDRs (SPY 60 min), 1.1.4 PowerShares QQQ Trust (QQQQ 60 min), 1.2.3 Diamonds (DIA 60 min).  Note the resistance.  RSI is close to the resistance, too.

8

A few interesting charts:

3.4.1 United States Oil Fund, LP (USO Daily).  It rallied for three days with a decrease of the volume.  This pattern is quite bearish.

9

The following chart is very interesting.  Take a look at two industrial groups which are highest above 50-day moving average and lowest below it, respectively.  Note that the problematic banks and home builders did not go under along with the recent selling-off.  On the contrary, the resource group dropped a lot.  What kind of information does this chart give us?  It is still a open question, and your comments and discussion are appreciated.

10

Thursday, September 18, 2008

09/18/2008 Market Recap: Follow-through wanted

Today many people were very excited about the massive rally of the market, and the government seems capable of doing anything they want. However my conclusion is that, the rally was too steep so it did not look like an ordinary Reversal Day which forms the intermediate term bottom. Therefore a follow-through tomorrow is wanted. Personally I will wait until the next Monday, and see what kind of great resolution our government can come up during a productive weekend before taking further actions.

0.0.0 Signal Watch and Daily Highlights. Now many oversold signals have been corrected.

1

1.2.7 Diamonds (DIA 15 min). Today's rally stopped at at Fib 61.8 which is also a resistance. Let's see if the resistance can be taken out tomorrow. For other major indices it is similar, and you may refer to the chart book for more details.

2

1.4.2 S&P/TSX Composite Index (60 min). Canadian market looks good, bullish falling wedge. Positive divergence on both MACD and RSI.

3

1.1.C TRINQ Trading Setup. Only this indicator predicts a downside risk for tomorrow's market, as TRIN closed below 0.6. So far the success rate of this setup is 77%, and it has been correct for the recent four times. Therefore I guess it will not be accurate tomorrow.

Disclaimer

The information contained on this website and from any communication related to the author’s blog and chartbook is for information purposes only. The chart analysis and the market recap do not hold out as providing any financial, legal, investment, or other advice. In addition, no suggestion or advice is offered regarding the nature, profitability, suitability, sustainability of any particular trading practice or investment strategy. The materials on this website do not constitute offer or advice and you should not rely on the information here to make or refrain from making any decision or take or refrain from taking any action. It is up to the visitors to make their own decisions, or to consult with a registered professional financial advisor.

This websites provides third-party websites for your convenience but the author does not endorse, approve, or certify the information on other websites, nor does the author take responsibility for a part or all materials on the third-party websites which are not maintained by the author.