Live Update

Sunday, November 30, 2008

11/28/2008 Market Recap: Market Overbought

Over the short term, the market is overbought, and may pullback at some point in the next week.  Over the intermediate term, an encouraging signal appeared on Friday.  Of course, the signal needs to be confirmed by the location where the pullback finishes, and it has to be a higher low.

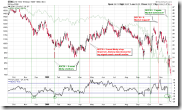
0.0.2 SPY Short-term Trading Signals.  NYADV and NYMO, which are used to be quite accurate, are overbought now.  Yes, Market may ignore these overbought signals temporarily, however do anyone really believe that NYADV will stay at overbought level and never come down?

1

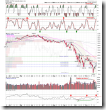
 1.0.3 S&P 500 SPDRs (SPY 60 min), RSI is overbought.  As mentioned in the past, RSI overbought/oversold on the 60-min chart is quite accurate.

2

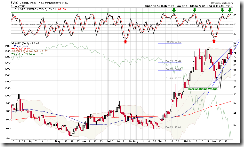
1.0.4 S&P 500 SPDRs (SPY 15 min), 1.1.6 PowerShares QQQ Trust (QQQQ 15 min), Bearish Rising Wedge, MACD and RSI show negative divergence.

3

As a summary, I believe a pullback is due in the short term.

0.0.3 SPX Intermediate-term Trading Signals.  NYSI buy signal.  So far, all mid-term signals are buy.

4

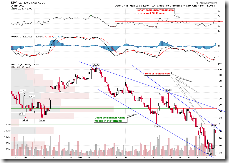
2.3.4 Nasdaq Total Volume/NYSE Total Volume.  Spike low, it looks very encouraging and like a bottom.  Last time of spike low is March, and then the market rallied for two months.

5

3.0.0 10Y T-Bill Yield.  Yield is dropping down continuously, which looks encouraging too.

6

Because of 2.3.4 and 3.0.0 signals, the mid-term outlook should be promising.

1.4.0 S&P/TSX Composite Index (Daily).  The Canadian market is overbought.

7

Thursday, November 27, 2008

11/26/2008 Market Recap: One more strength test

According to the statistics in the past 56 years, the probability of rally two days before or after Thanksgiving is about 80%.  Tomorrow the market will open a half day, hopefully there is no surprise.  In the short term, the market is very close to overbought, and in the intermediate term there are three buy signals already, while we still need to see if the pullback can form a higher low.

0.0.2 SPY Short-term Trading Signals.  This chart has given several overbought signals, but the most accurate one NYADV is not there yet.  Based on my simple strength judgement which compares up days and down days, if the high tomorrow can be above 92.06, we will confirm that the up strength is stronger.

1

1.4.0 S&P/TSX Composite Index (Daily).  Very close to oversold.  On the Tuesday report, the statistics shows that VIX breaking out of ENV 10 is actually bullish, however it will be over bullish if ENV 20 is broken.  Take a look at the ENV 20 (red curve at the bottom), VIX is not very far from breaking it.

2

1.0.3 S&P 500 SPDRs (SPY 60 min), 1.1.5 PowerShares QQQ Trust (QQQQ 60 min).  The pattern on the 60-min chart is likely a head and shoulders bottom, and a bigger head and shoulders bottom might be forming.  The theoretical target of QQQQ is 32.23.  By the way, RSI on the stop of chart is almost overbought.  If you look more carefully at the 60-min chart, overbought/oversold of RSI is quite accurate on the 60-min chart.

3

On T21122 of Telechart, as  discussed previously, 4 week new high / low index is very useful.  It is not in the overbought region at 90 yet.

4

As a summary, a few short-term overbought signals, NYADV, VIX ENV 20, RSI on 60-min chart, and T2122, are not in place yet.  The reason of listing them here is for your attention, it is not a bad idea to lock a part of profit.  The second reason is that, although I believe the pullback can happen at any time (in fact recently the market pulled back significantly in the middle of the day), I will not short at the current level because the short-term sell signals are not ready yet.  My strategy is to buy dip first if there are many mid-term buy signals, and will only go short when many short-term signals are pointing to pullback.

0.0.0 Signal Watch and Daily Highlights.  Here is the overview of all signals.  If the market rallies for two more days, most likely all short-term signals will be oversold, and mid-term signals will be buy.

5

3.0.3 20 Year Treasury Bond Fund iShares (TLT Daily).  I have been worrying about bond recently.  The stock market is going up while the bond rallied too.  However candles in recent two days on TLT have high likelihood of reversal, maybe I need not to worry about it?  If tomorrow the market goes up and the bond goes up again, considered so many close-to-overbought signals aforementioned, I will feel quite bearish.

6

1.1.6 PowerShares QQQ Trust (QQQQ 15 min). MACD and RSI negative divergence.

7

1.4.3 S&P/TSX Composite Index (15 min), On the Canadian market, Bearish Rising Wedge, MACD and RSI show negative divergence, not a good news.

8

1.5.0 Shanghai Stock Exchange Composite Index (Daily).  Although China cut the rate but it didn't break out,  What a pity.

9

1.3.7 Russell 3000 Dominant Price-Volume Relationships, Dominant Price-Volume Relationships on Wednesday was 1719 stocks price up volume down.  This might be affected by the holiday, so a series of bearish reading may not mean anything.

1.0.6 S&P 500 Bullish Percent Index, the buy signal on SPX bullish percent index has been confirmed by all major indices.

Tuesday, November 25, 2008

11/25/2008 Market Recap: No title

Tomorrow the market may still pull back since the short-term signals which supported the pullback listed in yesterday report are still there.  Today we have two mid-term buy signals, but it is too early to draw a conclusion that the intermediate-term trend is up before knowing how big the pullback is.

0.0.2 SPY Short-term Trading Signal.  All problems are explained on this chart.  Black candle with high probability of reversal, oversold VIX ENV, TICK closed above 1000, and three up days with decreasing volume which is a negative price-volume relationships, all are yelling short-term pullback.  On the other hand, what is different from the conventional wisdom is that, the statistics show that oversold VIX ENV and overbought TICK often show up when the market is relatively strong, the market may pullback in the short term however a decent rally can be expected over a longer period.  (statistics is at http://quantifiableedges.blogspot.com/2008/05/is-low-vix-short-trigger.html).

1

1.3.7 Russell 3000 Dominant Price-Volume Relationships, 1207 stocks price up volume down, bearish price-volume relationship for two days, this also means the market is due for a pullback.

2

0.0.0 Signal Watch and Daily Highlights.  Here is the overview of all signals.  CPC is very low at 0.79 today, which isn't a good sign.

3

3.0.0 10Y T-Bill Yield.  This is why I have a little hope about an intermediate-term up, ROC 30 is going further down.  At such a level, bond has little yield and the market may likely bounce back up.  You may check out the accuracy of TNX ROC30 in the past: 8.0.4 Market top/bottom by ROC30 of 10Y T-Bill Yield 2005-2008, 8.0.5 Market top/bottom by ROC30 of 10Y T-Bill Yield 2001-2004.

4

3.0.3 20 Year Treasury Bond Fund iShares (TLT Daily).  TLT is possibly a hanging man, and there are several gaps below the current level.  Furthermore, 3.0.0 has shown that the bond yield is very low, so I doubt how big the upside room is for TLT.  And it is reasonable to believe TLT has formed a hanging man pattern and due for a pullback, which may cause a rally of the stock market.

5

Monday, November 24, 2008

11/24/2008 Market Recap: Two day gains finally

Finally the market has been up in two consecutive days.  What is even more promising is that SPY has fully reclaimed the loss in previous two down days within this two up days.  So this is the first time that the market showed some up strength for a long time.  Next the market may likely pull back, and how big the pullback is will be a key to predict if this is a oversold bounce or intermediate term trend reversal.  Similarly, if the market does pull back for two days, we should check out whether the two down days fully takes off the two up days gain.

1

There is no clear signal to predict the market will pull back tomorrow.  However a few statistics show that the likelihood of pullback tomorrow is quite significant.

8.0.6 TICK and CPC.  This is most significant today, TICK closed above 1000, and CPC is way too bullish at 0.74.  However, two data are insufficient to draw a conclusion of pullback.  On the chart, there are 8 green lines which represent the next up day, and 12 red lines which show the next down day, so the possibility of getting a down day is about 67%.  Concerning the very low level of CPC, it doesn't necessarily means the market would correct on the next day according to the blue dashed lines on the chart.

2

1.0.5 Major Accumulation/Distribution Days.  Today is a major accumulation day, and the chart shows that the market might likely close lower.

1.3.7 Russell 3000 Dominant Price-Volume Relationships, 1969 stocks price up volume down, very bearish.  Although a short week may explain in some extent, I still consider 1969 a big number and this is relatively bearish pattern.  According to the statistics, the market may pull back tomorrow or as late as the day after tomorrow.

3

1.0.4 S&P 500 SPDRs (SPY 15 min), 1.1.6 PowerShares QQQ Trust (QQQQ 15 min), MACD and RIS show negative divergence.  Although the pattern isn't very significant, it is still a bit bearish to the further rally.

4

As mentioned early, pullback is okay and it is healthy.  The key is how big the pullback is.  There are two signs concerned me.  Whether my concern will become serious  depends on how the market goes in the next few days.

1.0.3 S&P 500 SPDRs (SPY 60 min).  The RSI 50-60 region has not broken out yet.  Unable to reach 70 of the oversold level is a sign of weakness for the market.

5

3.2.4 Yen RSI and the Market Top/Bottom.  Recently the level of RSI of Yen has marked the market top for several times.  Let's see if it becomes true again.

6

3.1.0 US Dollar Index (Daily).  US dollar broke down and confirmed the bearish dark cloud cover, which is a good news at the moment because the pullback favors the rally of commodities, and in turn this is a good news to commodities stocks.

7

2.0.0 Volatility Index (Daily).  VIX also broke down the bearish rising wedge, which is also a good news.

8

2.3.4 Nasdaq Total Volume/NYSE Total Volume.  This is quite encouraging too.  A relatively low value often means the market is bottomed out.

9

1.5.0 Shanghai Stock Exchange Composite Index (Daily).  The mainland market market may not be able to pass 50-day moving average.

10

Sunday, November 23, 2008

11/21/2008 Market Recap: Is 3rd time the charm?

The Friday's later day surge was the 3rd time we had recently. The previous 2 were all sold off the next day. So is 3rd time the charm or still the same easy money for bears? Well, I tend to believe that the 3rd time will be different. So short-term, the bounce might live a little longer than one day. And as for intermediate-term, if the past experiences still work at this crazy time, I tend to believe that Friday was not a bottom. Reason: the later day surge was too fast, conventional bottom day reversal usually doesn't act this way.


1.0.4 S&P 500 SPDRs (SPY 15 min), chart says everything. Friday's surge was the 3rd time. And I do believe that the 3rd time will be different.

SPY15min

2.1.2 NYSE - Tick, note the blue thick line just hit the thin green line which always generated very good bounces in the past. The bounce usually carried the thick blue line above the zero before running out of the steam. The Friday's surge didn't push the thick blue line above the zero, so this probably means there's still some room left for the bounce.

TICK

3.0.0 10Y T-Bill Yield, ROC30 has reached an extremely low level which in the past always caused some big rallies, so this also supports that there might be some up room left for the bounce.

TNX

2.0.0 Volatility Index (Daily), possible Bearish Rising Wedge, plus STO hit resistance, VIX might drop further and this is good for the market.

VIXDaily

1.0.3 S&P 500 SPDRs (SPY 60 min), how far will the bounce go? Look at tons of resistance ahead, period.

SPY60min

0.0.4 SPX and Breadth Divergence Watch, for above mentioned reasons, I myself have decided to ignore what this chart says, but it's my responsibility to let you know that on Friday, NYAD failed to confirm the surge. This was exactly the same pattern as that of Nov 13th which was sold off the 2nd day. So be careful here.

SPXBreadthDivergenceWatch


If we do get a further bounce, then here's a simple rule to verify if the Friday is a bottom.

0.0.2 SPY Short-term Trading Signals, in order to prove that this was a trend reversal instead of a bounce, on Monday, SPY should have a high which is higher than 86.87. Why? As my previous report described, 2 down days vs 2 up days, the latter should fully recover the previous 2 in order to prove that the up strength is stronger. By the way, STO, NYADV and TICK are still in the oversold area, so as well, they support a further bounce.

SPYShortTerm


3.1.0 US Dollar Index (Daily), Bearish Dark Cloud Cover, US$ might pullback.

USDDaily

3.3.0 streetTRACKS Gold Trust Shares (GLD Daily), breakout, although the RSI2 above is overbought. If US$ pullback, gold will have good chances of going further up from here.

GLDDaily

5.0.2 S&P Sector Bullish Percent Index, from the Bullish Percent Index point of view, all sectors are back to historical low level now.

SectorBPI

Thursday, November 20, 2008

11/20/2008 Market Recap: Uncharted Territory

The possibility of short-term rebound is still quite high.  Concerning the trend reversal in the intermediate term, we have a news unrelated to TA -- the discussion of bailout plan for the three automakers will be postponed to December.  With such a big uncertainty, I guess the mid-term trend reversal won't happen until December.

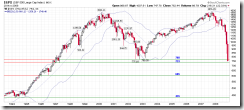
1.0.2 S&P 500 Large Cap Index (Monthly).  2002 low that everyone was talking about has broken without any battle.  Look at the possible supports underneath.  Around 1994 there is a significant consolidation area.  Therefore, only that region can provide decent support theoretically.  Of course myself doesn't even believe the market could drop there.

1

0.0.2 SPY Short-term Trading Signals.  All signals are oversold.

2

1.3.7 Russell 3000 Dominant Price-Volume Relationships.  Today's dominant price-volume relationships are oversold, 2058 stocks price down volume up.

3

2.1.2 NYSE - Tick.  TICK is still extremely negative, which means the market could bounce back in the early morning.

4

3.0.0 10Y T-Bill Yield.  This is about rebound too.  Note the green dashed lines, when ROC30 goes below -9, the market which is denoted by the green curve on the background of the chart has a high chance to bounce back up.  When the bond yield is very low, the money will consider the stock market is cheaper and flow to it.  Of course, I don't know if the money is still willing to flow into the stock market given such an extraordinary situation.  Today's 3-month US T-bill Yield (3.0.2 TED Spread) is almost zero, which shows that the money is extremely panic.

5

3.0.3 20 Year Treasury Bond Fund iShares (TLT Daily).  Look at TLT, such a monster candle.  The volume today is huge, and the moneys were really scared.  RSI shows that TLT is overbought, STO reaches the level where the reversal happened last time.  Therefore TLT might pull back, which means the market may bounce back up.

6

Wednesday, November 19, 2008

11/19/2008 Market Recap: NYSE TICK

Today the market was very disappointing.  It seems the pattern of single up day holds very well, and on the other hand the down days never appear as single day.

Recently it has been tough to write the report.  TA assumes the history repeats itself.  However the current situations seems the the market is writing the history.  So we should keep cautious when using all kinds of TA signals which were accurate in the past.  According to very negative NYSE TICK, I believe the market is approaching capitulation, and at least the market might bounce back up in the early morning.  However if the market sells off further without any rally, the chance is tomorrow might be a reversal day.

1.0.2 S&P 500 Large Cap Index (Monthly).  (it is unbelievably that we have to use the monthly chart for analysis)  Today SPX broke out at the down side and formed a new low in 2008, and it seems 2002 low will be tested.  SPX closed at 806, which is merely 38 points from 2002 low at 768.  If the market doesn't bounce back up tomorrow morning but sells off continuously, the possibility of testing 2002 low and forming a reversal should be very high.  Of course, will the market be bottomed out after the reversal?  I don't know, follow-through is the key, and recently we don't have it.

1

0.0.2 SPY Short-term Trading Signals, VIX ENV overbought, NYADV is still on the oversold level while NYMO is very close to oversold.  What is important is the TICK, which close is very negative today.  It happened four times in this year as marked by green dashed line.  If the history repeats itself, tomorrow we may see a big sell off (testing 2002 low?) but the trend may reverse during the day.

2

Here is the NYSE TICK 30-min chart since Oct 8th.  Usually the value of TICK below -1000 is considered to be very negative, and too negative usually means reversal.  As marked in green circles on the chart, many negative ticks are often local bottoms.  13th, a big reversal was triggered by a record-breaking TICK.  Note that negative ticks below -1000 in recent two days are quite intensive, and are even heavier than the Oct 10th bottom.  This is why I say in the beginning of the report, the market is approaching a capitulation according to TICK.

3

2.8.1 CBOE Options Total Put/Call Ratio.  Today CPC is above 1.4.  In the past this means the bottom of the market.  Of course it may not mean anything for the current situation.

4

2.0.0 Volatility Index (Daily).  VIX is still in the rising wedge.  But I don't have any hope on it.  It may break out at the up side, instead of at the down side.

5

3.0.3 20 Year Treasury Bond Fund iShares (TLT Daily).  Do you remember the last warning on the yesterday report?  Now we know the bond market is accurate.  Anyway, TLT is overbought, and the possibility of STO reversal is pretty high.

6

Disclaimer

The information contained on this website and from any communication related to the author’s blog and chartbook is for information purposes only. The chart analysis and the market recap do not hold out as providing any financial, legal, investment, or other advice. In addition, no suggestion or advice is offered regarding the nature, profitability, suitability, sustainability of any particular trading practice or investment strategy. The materials on this website do not constitute offer or advice and you should not rely on the information here to make or refrain from making any decision or take or refrain from taking any action. It is up to the visitors to make their own decisions, or to consult with a registered professional financial advisor.

This websites provides third-party websites for your convenience but the author does not endorse, approve, or certify the information on other websites, nor does the author take responsibility for a part or all materials on the third-party websites which are not maintained by the author.