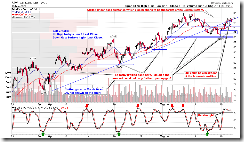
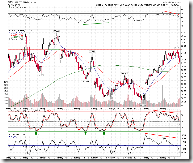
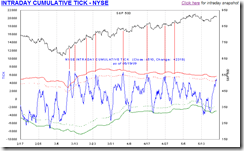
Live Update

Sunday, May 31, 2009

05/29/2009 Market Recap: Firework may continue, but…

Summary:

Firework may continue with 63% chances the SPX closes in green next Monday.

A surging bond price told a different story however, just I'm not sure if bond and stock should trend together now.

  Trend Momentum Comments - Sample for using the trend table.
Long-term Down   Idea for trading intermediate-term under primary down trend.
Intermediate Down Neutral Wait breakdown bellow SPX 878 to confirm sell signals.
Short-term Up Neutral  

*Today’s report has no conclusion, stop here you’re simply looking for the word “up” or “down”.

As far as I can see that the last 5 min price surge last Friday made the bulls very excited. Well, not too soon, let’s take a look at the fact first.

http://quantifiableedges.blogspot.com/2008/10/late-day-market-surges.html, statistically it’s called an over reaction, so it doesn’t guarantee an up Monday. Though, we’ve seen lots of similar cases where the price surges right before the market closes, the next day tends to open very high as big money seems to always know something before we retailers. So I could understand the bull’s excitement and am willing to give a support to bulls, hmm, morally.

7.1.0 Use n vs n Rule to Identify a Trend Change, looks like that bears are not that weak.

NvsN

8.0.3 Use n vs n Rule to Identify a Trend Change 2008, be reminded again how the market usually tops with several up and down.

NvsN2008

So the conclusion is that before the trading range is actually broken, still there’s a possibility the the market is in a topping process. Also 0.0.3 SPX Intermediate-term Trading Signals, a Descending Triangle could be in the forming therefore a breakout on the downside has higher chance. And also, according to pattern expert Bulkowski: price sometimes breaks out in one direction and then reverses to bust out in a new direction, so even the range is broken, either bulls or bears, don’t yell “told you so” too soon. LOL

SPXMidTerm


Very short-term, not sure an up or down Monday. Yes, CPC < 0.8, so according to 7.0.4 Extreme CPC Readings Watch, there’re 63% chances that the SPX may close in green. And also according to 7.3.2 Firework Trading Setup, the firework shall continue. But, here’s a big but…

Firework 

7.0.6 SPX and TLT Divergence Watch, we all know that the stock and the bond are trending in opposite direction. OK, let’s see what happened on Friday. Both SPX and TLT were up big. From the chart, we can see whenever this happened the next day was not very pleasant. Well, not too soon to get excited, bears, here comes another big but…

SPXTLTWatch

7.1.4 Gold vs Oil, the stock and the yield trending together (since the yield is the opposite of the bond so the stock and the bond are trending in opposite direction) only happens on the age of  low inflation while in 90s, when inflation was high, the stock and the yield were trending in opposite direction. The question now is: are the stock and the yield still trending together? In 05/27/2009 Market Recap: The 3rd Bearish Reversal Day, I’d explained that the US government needs to issue huge debt so it’s inevitable that the yield would go higher, but if the yield is tool high, it’d be no good for the economic recovery, therefore logically, I believe from now on, the stock and the yield are trending in opposite direction. And this means that the stock and the bond could rise and fall together. So, accordingly, I cannot rule out the possibility that the rise together of TLT and SPX last Friday was actually healthy. By the way, I’ve been asked several times about the gold, from this chart, if you believe that we’re entering an inflation age then the gold is still very very cheap.

GoldvsOil

Well, still don’t believe the yield will rise, let me explain it in another way, why it’s inevitable that the yield will be rising. The US government needs to issue around 2T debt while the Fed plans to buy back only 300B, so the rest 1.7T has to rely on us patriots as well as foreign investors, who apparently love the US so much, that no matter how high the stock market is soaring, no matter how low the yield is going and no matter how worthless the US$ will be, simply keep buying and buying and buying the US debt, because we all love the US, yeah!

So the conclusion is not sure about short-term and intermediate-term, be patient, let the market unfolds itself.


The following charts are for your reference only.

1.0.2 S&P 500 SPDRs (SPY 60 min), cycle worked so far so good, and the Friday happened to be the end of 7 trading days cycle.

SPY60min 

7.5.0 S&P 500 Large Cap Index (Monthly), 7.5.1 Nasdaq Composite (Monthly), up 3 months in a row, the longest rebound in year 2000 bear market was up 3 months in a row too.

COMPQMonthly

Thursday, May 28, 2009

05/28/2009 Market Recap: Firework

Summary:

62% chances the SPX will close in green tomorrow.

Firework trading setup was triggered.

  Trend Momentum Comments - Sample for using the trend table.
Long-term Down   Idea for trading intermediate-term under primary down trend.
Intermediate Down Neutral Wait breakdown bellow SPX 878 to confirm sell signals.
Short-term Up Neutral  

Not much to say today. Ever after May the 1st, there’s no record for SPY being up 2 days in a row, so tomorrow will be the SPY’s last chance to break this curse. Will SPY be able to do so? Because CPC closed bellow 0.8 today, so according to 7.0.4 Extreme CPC Readings Watch, there’re 62% chances that SPY may close in green tomorrow.

CPCWatch

 7.3.2 Firework Trading Setup, CPC < 0.8 also triggered a “Firework” today. This setup worked pretty good so far.

Firework

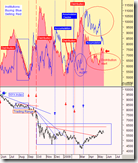
Institutional Buying and Selling Trending

As per request here is the most recent institutional buying and selling chart from www.stocktiming.com.

instbsell

Wednesday, May 27, 2009

05/27/2009 Market Recap: The 3rd Bearish Reversal Day

Summary:

Bears must bring the SPX down bellow 878 tomorrow to prove themselves.

The long term bond yield might be the market's biggest concern from now on.

  Trend Momentum Comments - Sample for using the trend table.
Long-term Down   Idea for trading intermediate-term under primary down trend.
Intermediate Down Neutral Wait breakdown bellow SPX 878 to confirm sell signals.
Short-term Up Neutral  

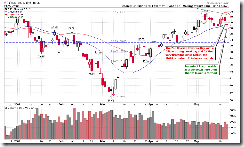
Today is the 3rd bearish reversal day since May. The previous 2 so far didn’t cause any real trend change. Will the 3rd time be the charm? A follow-through tomorrow is needed to confirm the today’s reversal. And according to 7.1.0 Use n vs n Rule to Identify a Trend Change, if we do have a follow-through tomorrow, the low must be lower than 878 to prove that indeed bears rule this time.

SPYShortTerm  NvsN

3.0.0 10Y T-Bill Yield, sharply rising yield is the main reason for today’s sell off, which I believe, will be the market’s major concern from now on.

TNX 

Why the sharply rising yield will be the market’s major concern? I have no financial background so just let me explain it in a simple way from my simple naive understandings. From economy point of view, higher yield means higher borrowing cost and therefore is not good for the economy to recover. We all know that the current Fed rate is near zero, so in order to further bring down the borrowing cost, the Fed announced a buy back program to buy back treasury bill, but this is far not enough for what the US government needs therefore it still needs other investors to participate. The problem is, if the yield is not high enough, the other investors won’t be interested, while if the yield is too high, it’ll be not good for the economy to recover. Well, anyway, this sounds like a dead lock to me. The sharply rising yield today made people worry if the Fed is still in control and therefore a further worry about the recovery of the economy and eventually causing the sell off the stock market. By the way, it seems to me another dead lock here: if you believe a bull market has started, then the rising stock market would mean a higher yield, while a higher yield would do no good to the economy, while if the economy couldn’t recover then why the stock market went so high? The following chart illustrates what’s going on now, again from my simple naive understandings.

FEDsTale

Tuesday, May 26, 2009

05/26/2009 Market Recap: Bullish Engulf

Summary:

Maintain "down" view on the intermediate-term but better wait until SPX 878 broken before taking further actions.

Expect a pullback tomorrow.

  Trend Momentum Comments - Sample for using the trend table.
Long-term Down   Idea for trading intermediate-term under primary down trend.
Intermediate Down Neutral  
Short-term Up* Neutral  

A Bullish Engulf pattern was formed today which looks bullish. Although the volume seemed a little low comparing with the relative bigger rising rang but since I’ve seen so many cases continuing up on decreased volume, so I don’t think it’s the reason to be bearish. Because no sell signals are changed in chart 0.0.3 SPX Intermediate-term Trading Signals, so, no argue with signals, maintain the “down” view on the intermediate-term. If you plan to follow the intermediate-term sell signal but have yet started, suggest to wait until SPX 878 is broken in case all the sell signals given by chart 0.0.3 are whipsaws. If you’ve already started shorting then don’t average down now, wait to see if the market could follow though the today’s Bullish Engulf pattern. Tomorrow, because very short-term is very overbought, so I expect a pullback and eventually a red close.

SPXMidTerm


2.8.0 SPX:CPCE, this is the main reason for expecting a pullback tomorrow: CPCE is way too bullish and every time it’s this bullish the next day wasn’t very pleasant.

SPXvsCPCE

Short-term model from www.sentimentrader.com, overbought. This model works pretty well recently so I consider it as another reason for expecting a pullback tomorrow.

STEM.MR

From seasonality however, as reported in the weekend' report, tomorrow is the 2nd most bullish day in May. Also it’s a very common pattern that a big price bar (such as today) is followed by a small price bar (for consolidation purpose). So a reasonable guess for tomorrow is a small red price bar or a Doji bar. 

Seasonality


The follow are for your reference only as I’m trying to add the “cycle” analysis into my daily report gradually.

1.0.2 S&P 500 SPDRs (SPY 60 min), the 7 trading day cycle and 13 trading day cycle are very interesting (For bigger picture please see 7.6.1 SPX Cycle Watch (60 min)). Today happens to be the end of the 13 trading day cycle which was usually a turning point in the past. So does this mean a turning point tomorrow? Well, let’s wait and see.

SPY60min 

7.6.0 SPX Cycle Watch (Daily), 3 interesting cycles on the daily chart. By the way, the March bottom happens to be the joint point for all these 3 cycles and that could be the reason why the rally we’ve seen is so powerful. LOL

SPXDailyCycle

Saturday, May 23, 2009

05/22/2009 Market Recap: No Title

Summary:

Could be more pullback next Tuesday. SPX 878 is the key to watch if the pullback does happen.

From seasonality statistics, Wednesday will be the 2nd most bullish day in May.

  Trend Momentum Comments - Sample for using the trend table.
Long-term Down   Idea for trading intermediate-term under primary down trend.
Intermediate Down Neutral  
Short-term Down Neutral  

Very short-term neutral to overbought plus the day after the Memorial day usually is bearish, so probably more pullbacks next Tuesday.

holiday_memorial 

According to 7.1.0 Use n vs n Rule to Identify a Trend Change, if we do get a pullback Tuesday, watch SPX 878, bears must push the SPX down bellow it to prove themselves.

NvsN

Wednesday, by the way,  is the 2nd most bullish day in May.

Seasonality 


Not much else to say. Maintain “not bull friendly” view on intermediate-term. Refer to 05/21/2009 Market Recap: Follow Through for more details.

1.1.1 Nasdaq Composite (Weekly), looks bearish with 3 reversal bars in a row.

COMPQWeekly 

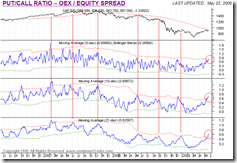
OEX/Equity Spread from www.sentimentrader.com, this is the same as my 2.8.2 Normalized CPCI:CPCE. If the spread between the OEX put/call ratio (representing big players) and the equity only put/call ratio is too large, the intermediate-term is usually not so good for bulls.

OEXEquitySpread  CPCIvsCPCE

3.0.0 10Y T-Bill Yield, breakout! Lots of people believe that the US government could bring us a bull market, but if the stock market keeps going up then the bond yield will skyrocket too and therefore the long term mortgage rate and my question is how the real estate market is supposed to recover? Bellow is the comment form www.stocktiming.com,just for your reference.

  • 30 Year Yield:   Market forces want higher yields even as the Fed is trying to work 30 year mortgages down to "a target" of 4.25% to 4.5%.   The Fed's buying for the sole purpose of driving rates down, makes this an "interfered-with or manipulated" market.   As the Fed tries to drive down rates to below 4.5%, they are creating a bond bubble that will have a bad ending.  *** On April 29th, we started mentioning the probability that the 30 year yields would move up to 41.45.  On Friday, May 8th., 41.45 was hit on a spike up that took us even higher with a closing of 42.61
  • Yesterday, the 30 year yields jumped up again and closed at 43.13.  This was above both long term resistance levels.  The Fed still has over 250 billion to use in trying to keep yields and mortgages down ... we wish you luck, Ben.

TNX

Institutional Buying and Selling Trending from www.stocktiming.com,again for your reference.

instbsell

Thursday, May 21, 2009

05/21/2009 Market Recap: Follow Through

Summary:

Could be more rebound at least tomorrow morning.

More signals confirming an intermediate-term top.

  Trend Momentum Comments - Sample for using the trend table.
Long-term Down   Idea for trading intermediate-term under primary down trend.
Intermediate Down Neutral  
Short-term Down* Neutral  

I consider today’s drop as a follow-through of the yesterday’s Bearish Reversal. With more intermediate-term sell signals triggered and more potential topping signals, it does not look good for bulls. Very short –term, because of oversold plus a few positive divergences, so there could be more rebound at least tomorrow morning.

SPYShortTerm


1.0.3 S&P 500 SPDRs (SPY 30 min), this is my main reason for the tomorrow’s rebound, oversold plus lots of positive divergences. (Noticed a potential Double Top could be in the forming. But without a breakdown bellow the neckline to confirm this indeed is a Double Top pattern, it’s not a reason to be bearish though.)

SPY30min 


0.0.0 Signal Watch and Daily Highlights, this is the overall signals for my chart book at www.stockcharts.com. The trend following indicators are all yelling for sale, either short-term or intermediate-term. While on the other hand, all the momentum indicators are mostly deadly neutral, so I expect more pullbacks ahead. 1.3.7 Russell 3000 Dominant Price-Volume Relationships, 1501 stocks price down volume down, this is a typical continuation pattern in the bear market, so it supports for more pullback as well.

SignalWatch

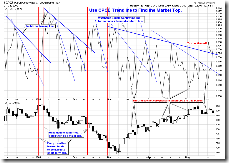
2.8.0 CBOE Options Equity Put/Call Ratio, double confirming line was broken today confirming a potential market top. This signal, ever since I found “the trend line rule” since year 2007, only went wrong once (04/20/2009 Market Recap: The rally might be over). But last time when it went wrong, it was without 2.8.3 SPX:CPCE’s confirmation.  This time, however, both 2.8.0 and 2.8.3 have confirmed.

CPCE  SPXvsCPCE

1.2.0 INDU Leads Market, INDU made a lower low today, if the past pattern illustrated on the chart still holds true then SPX will follow soon.

INDULeadsMarket


The following charts are for your info only:

3.1.1 PowerShares DB US Dollar Index Bullish Fund (UUP 30 min), RSI oversold plus lots of positive divergence, US$ may rebound, it’s not good for the stock market.

UUP30min 

3.0.0 10Y T-Bill Yield, just to remind you that when yield rises, not only the stock market could be topped but also means a possible higher mortgage rate.

TNX 

Performance Surrounding Memorial Day from www.sentimentrader.com.

holiday_memorial

Wednesday, May 20, 2009

05/20/2009 Market Recap: Bearish Reversal Day

Summary:

The 2nd bearish reversal day, need a follow-through tomorrow to confirm.

Could be a Head and Shoulders Top formed on SPY/QQQQ 15 min chart.

  Trend Momentum Comments - Sample for using the trend table.
Long-term Down   Idea for trading intermediate-term under primary down trend.
Intermediate Down Neutral  
Short-term Up Neutral  

Not much to say, I see no edges for either bulls or bears tomorrow, so my guess is that if tomorrow cannot go up then it should go down. LOL

0.0.2 SPY Short-term Trading Signals, today is the 2nd bearish reversal day since May. The daily chart looks bearish, but since the market’s invincible bullishness has caused a mental damage to me, I’m really not sure if this or any reversal pattern says anything meaningful. Well, at least the day after the 1st bearish reversal day was up really really big. So it’s definitely not the time for bears to celebrate, at least not until a follow-through tomorrow kicks in.

SPYShortTerm 

1.0.4 S&P 500 SPDRs (SPY 15 min), 1.1.6 PowerShares QQQ Trust (QQQQ 15 min), looks like a Head and Shoulders Top pattern.

SPY15min 

1.3.7 Russell 3000 Dominant Price-Volume Relationships, 1066 stocks price down volume up, not very significant readings but a little bit “bear friendly” which may mean a pullback just started.

RUA 

3.1.1 PowerShares DB US Dollar Index Bullish Fund (UUP 30 min), RSI oversold on 30 min chart seems accurate recently, so US$ may rebound tomorrow, this is also a little bit “bear friendly”.

UUP30min

By the way, 7.0.7 SPX and VIX Divergence Watch, no higher high on SPX but a lower low is formed on VIX daily chart, this is a divergence, but I’m not sure whether this kind of divergence should be counted as negative or positive.


P.S. Thanks to the referring from VIX and More, the visits to my blog hit new high yesterday. I want to say thanks to him here again and please pay visit to VIX and More, I’m sure you will find lots of valuable posts there. Also I want you to know that in chart 0.0.3 SPX Intermediate-term Trading Signals, the VIX:VXV indicator is originated from VIX and More.

Dashboard

Institutional Buying and Selling Trending

OK, institutional buying and selling trending says nothing new today, but a promise is a promise, so I post it here, courtesy of www.stocktiming.com.

instbsell

Tuesday, May 19, 2009

05/19/2009 Market Recap: Consolidation Day

Summary:

Bulls have 3 days to push above SPX 930 to prove themselves.

Expect more pullback at least tomorrow morning.

  Trend Momentum Comments - Sample for using the trend table.
Long-term Down   Idea for trading intermediate-term under primary down trend.
Intermediate Down Neutral All but one intermediate-term sell signals are confirmed.
Short-term Up Neutral  

A wide range bar followed by a small range bar on decreased volume, this is a typical consolidation pattern, so both bulls and bears have 50% chances tomorrow. (Please refer to 7.2.0 Small Body Bar Trading Rule for discussion about a day like today) Short-term, I expect more pullbacks at least tomorrow morning. Intermediate-term, according to 7.1.0 Use n vs n Rule to Identify a Trend Change, bulls have 3 days left to prove themselves.

NvsN


Reasons for more pullbacks tomorrow:

1.0.2 S&P 500 SPDRs (SPY 60 min), still overbought and still looks like a breakdown then back test the broken trend line.

SPY60min 

1.0.4 S&P 500 SPDRs (SPY 15 min), negative divergence has already caused a pullback before the close. Because of the overbought on chart 1.0.2 S&P 500 SPDRs (SPY 60 min) mentioned above, so probably there’ll be more pullbacks.

SPY15min 

2.0.0 Volatility Index (Daily), MA ENV oversold, it happened 3 times recently, all led to a red day the next day. However, from chart 7.0.7 SPX and VIX Divergence Watch, when both SPX and VIX closed in red on the same day, 5 out of 6 times recently the next day closed in green, so accordingly, I’m not sure if the market could eventually close in red tomorrow.

VIXDaily  SPXvsVIX

Intraday Cumulative TICK from www.sentimentrader.com, overbought.

CumTICKNYSE 

STEM.MR mode (which is a short-term trading mode) from www.sentimentrader.com, overbought.

STEM.MR 

Seasonality from www.sentimentrader.com, statistically tomorrow will be the 2nd most bearish day in May.

Seasonality


The following are for your info only:

3.4.1 United States Oil Fund, LP (USO Daily), I believe USO will breakout on the upside eventually. This is good for the overall market, especially Canadian market, for a short period of time at least. But, I wonder (well, don’t think too much, this has nothing to do with today’s market analysis), if you have ever noticed that now you have to pay more to fill your tank?

USODaily 

Institutional Buying and Selling Trending, posted this morning, it seemed that institution didn’t participate the yesterday’s rally. Tomorrow morning before opening, again I’ll post the most updated chart. If the trend goes on, i.e. the market simply up and up without institution’s participation, bulls better be careful.

Large Nasdaq Price Moves On Weak Volume, enough said the consequences of a big up day like yesterday without much of institutional participation.

Another TICK Milestone, TICK was extremely bullish in the recent 2 days (well, I didn’t notice that), 3 times this happened, I checked myself, it’s not exactly as what the post said, “a short-term weakness”, it’s actually a very big correction. 

Anyway, if the above info is true, I believe we’re very close to a turning point now.

Disclaimer

The information contained on this website and from any communication related to the author’s blog and chartbook is for information purposes only. The chart analysis and the market recap do not hold out as providing any financial, legal, investment, or other advice. In addition, no suggestion or advice is offered regarding the nature, profitability, suitability, sustainability of any particular trading practice or investment strategy. The materials on this website do not constitute offer or advice and you should not rely on the information here to make or refrain from making any decision or take or refrain from taking any action. It is up to the visitors to make their own decisions, or to consult with a registered professional financial advisor.

This websites provides third-party websites for your convenience but the author does not endorse, approve, or certify the information on other websites, nor does the author take responsibility for a part or all materials on the third-party websites which are not maintained by the author.