Live Update

Wednesday, June 30, 2010

06/30/2010 Market Recap: Head and Shoulders Top To Be Confirmed

  TREND INDICATOR MOMENTUM INDICATOR COMMENT (Click link to see chart)
Long-term 3 of 3 are BUY    
Intermediate 3 of 3 are SELL 5 of 5 are NEUTRAL Non-Stop Model is in SELL mode
Short-term 2 of 2 are SELL 3 of 6 are OVERSOLD SPY ST Model is in BUY mode
GANN DAY MOON/SOLAR CYCLE & TIME FIB CONCLUSION
07/07-07/11 07/11 / 07/07 07/31, 08/20-08/23 Next pivot date: 07/07-07/11
BULLISH 0.2.1 10Y T-Bill Yield: ROC < –9%, bottomed?
6.3.2c Major Distribution Day Watch: MDD > 35, bottomed?
BEARISH 4.1.0 S&P 500 Large Cap Index (Weekly): bearish engulfing was bearish for the next several weeks.
*4.1.0 S&P 500 Large Cap Index (Weekly): Head and Shoulders Top to be confirmed.
SPY SETUP ENTRY DATE STOP LOSS INSTRUCTION: Mechanic signals, back test is HERE, signals are HERE.
TRADING PLATFORM:
SSO/SDS, UPRO/SPXU
ST Model   *Possible sell short signal, if SPY tomorrow’s open > tomorrow’s close and has a  new low. May not be a good timing, so be careful.
Reversal Bar    
NYMO Sell    
Non-Stop(RSP) 06/30 S N/A *Closed the long entered on 06/17 with loss and shorted on 06/30.
Be sure to check the chart from 8.2.2a Combined Intermediate-term Trading Signals – 2004 to 8.2.2g Combined Intermediate-term Trading Signals – 2010 to understand the risks of trading on trend following indicators which usually has a lower winning rate and relies heavily on a few winning trades to profit in the long run.

*Please make sure you understand how to use the table above. The main purpose of this report is to provide information so contradictory signals are always presented.

SEASONALITY: BEARISH MONDAY TO WEDNESDAY, BULLISH THURSDAY AND FRIDAY

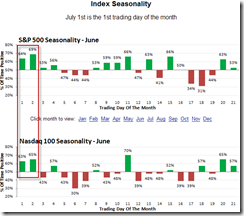
Form the July seasonality chart (courtesy of sentimentrader) below, we can see tomorrow and the day after tomorrow are very bullish. In the 06/25 Market Recap, I’ve also listed some statistics arguing for bullish tomorrow and the day after tomorrow, take time to review them because the bull’s only hope is the seasonality now. The bottom line, as mentioned in 06/29 Market Recap, QQQQ down 7 days in a row means the downward pressure is high so most likely the very first rebound attempt would fail and after that at least there shall be one more leg down.

JulySeasonality 

INTERMEDIATE-TERM: HEAD AND SHOULDERS TOP TO BE CONFIRMED

4.1.0 S&P 500 Large Cap Index (Weekly), the main story today is the Head and Shoulders Top neckline breakdown, considering the statistics mentioned in 06/25 Market Recap about weekly bearish engulfing, this Head and Shoulders Top could be as real as it gets, so be careful bulls.  Personally, I prefer to wait for a few days to make sure this is indeed a Head and Shoulders Top breakdown.

SPXWeekly 

I purposely post the chart below in advance so that bulls could be prepared, even eventually it proves that I’m totally wrong, it’s no harm to be prepared for the worst case I think. If, I mean IF, indeed the Head and Shoulders Top is confirmed in the following days then the current correction should be at higher level than that of happened in June 2009 and Jan 2010. If the 03/06/2009 to 04/26/2010 was a clear 5 wave up then at least what we are having now is an ABC correction, so the min correction time could be Fib 38.2% from 03/06/2009 to 04/26/2010 which is on 10/02/2010. This looks still far far away and that’s why I want bulls to be prepared in advance. By the way, there’re 2 multiple cycle date confluences area on the chart below. One is 07/31 to 08/02, the other one is 08/22 to 08/24. These 2 time windows could be very important although right now it’s hard to know whether they mean a top or bottom.

TimeTarget 

SHORT-TERM: BE CAREFUL OF NASDAQ INTRADAY CUMULATIVE TICK

I said in today’s After Bell Quick Summary that I’d WOW tonight. Here’s the chart. I don’t understand what’s going on here but the cold fact is the previous 8 times (06/25 Market Recap, 06/02 Market Recap, 05/26 Market Recap, 05/18 Market Recap, 05/12 Market Recap, 05/03 Market Recap, 04/29 Market Recap, 04/20 Market Recap and 04/14 Market Recap) when I WOW-ed, the market was all sold off hard no later than the day after tomorrow, so be careful bulls.

IntradayCumTICK 


HIGHLIGHTS OF THE OTHER ETFS IN MY
PUBLIC CHART LIST
*DTFMS = Dual Time Frame Momentum Strategy. The signal is given when both weekly and daily STO have the same buy/sell signals. Use it as a filter, don’t trade directly.
  TREND *DTFMS COMMENT – *New update. Click BLUE to see chart if link is not provided.
QQQQ UP *SELL  0.1.3 Nasdaq 100 Index Intermediate-term Trading Signals: ChiOsc a little too low.
IWM DOWN *SELL *Ascending Broadening Wedge breakdown, target $54.97.
CHINA DOWN
EMERGING UP SELL
EUROPEAN UP
CANADA DOWN SELL
BOND UP BUY Breakout but ChiOsc is way too high now.
EURO DOWN
GOLD UP 4.3.0 Gold Trust Shares (GLD Weekly): Head and Shoulders Bottom, target $129.99.
GDX UP 4.3.1 Market Vectors Gold Miners (GDX Weekly): GDX:$SPX is too high.
OIL UP
ENERGY DOWN SELL *ChiOsc a little too low.
FINANCIALS DOWN
REITS UP *SELL 4.4.3 Real Estate iShares (IYR Weekly): Pay attention to XHB weakness!
MATERIALS *DOWN SELL  

06/30/2010 After Bell Quick Summary

Well, I don’t understand what’s going on here, a program keeps bidding Nasdaq stocks higher? For what? I believe we’ll see a new record high of the Nasdaq Intraday Cumulative TICK. So, yes, I’m going to WOW in tonight’s report again (why wait for tonight, because I don’t have the final confirmed chart yet, LOL). The last 9 times, I WOWed were in 06/25 Market Recap, 06/02 Market Recap, 05/26 Market Recap, 05/18 Market Recap, 05/12 Market Recap, 05/03 Market Recap, 04/29 Market Recap, 04/20 Market Recap and 04/14 Market Recap. The market all sold off hard thereafter.

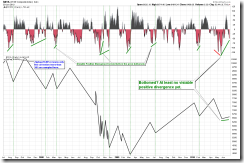
Looking for NYMO positive divergence I mentioned in the last night report? Well, not yet, still missed a hair and not to mention that it’s far from being “visible”. I modified the chart a little bit so that you could see clearly…

1

Tuesday, June 29, 2010

06/29/2010 Market Recap: SPX Lower Close Ahead?

  TREND INDICATOR MOMENTUM INDICATOR COMMENT (Click link to see chart)
Long-term 3 of 3 are BUY    
Intermediate 3 of 3 are SELL 5 of 5 are NEUTRAL Non-Stop Model is in SELL mode
Short-term 2 of 2 are SELL 3 of 6 are OVERSOLD SPY ST Model is in BUY mode
GANN DAY MOON/SOLAR CYCLE & TIME FIB CONCLUSION
07/07-07/11 07/11 / 07/07 07/31, 08/20-08/23 Next pivot date: 07/07-07/11
BULLISH 0.2.1 10Y T-Bill Yield: ROC < –9%, bottomed?
*6.3.2c Major Distribution Day Watch: MDD > 35, bottomed?
BEARISH 0.0.2 Combined Intermediate-term Trading Signals: trend line broken, topped?
6.3.2b Major Distribution Day Watch: 2 MDD within 5 days means an intermediate-term downtrend?
4.1.0 S&P 500 Large Cap Index (Weekly): bearish engulfing were bearish for the next several weeks.
*6.4.1a Extreme NYADV Readings Watch: SPX will close below 1041.
SPY SETUP ENTRY DATE STOP LOSS INSTRUCTION: Mechanic signals, back test is HERE, signals are HERE.
TRADING PLATFORM:
SSO/SDS, UPRO/SPXU
ST Model  
Reversal Bar    
NYMO Sell    
Non-Stop(RSP) 06/17 L N/A *Close current long position and sell short tomorrow.

*Please make sure you understand how to use the table above. The main purpose of this report is to provide information so contradictory signals are always presented.

SEASONALITY: BEARISH MONDAY TO WEDNESDAY, BULLISH THURSDAY AND FRIDAY

See 06/25 Market Recap for more details.

INTERMEDIATE-TERM: PROBABLY NOT BOTTOMED TODAY

Bottomed? The answer is probably not for 2 reasons:

6.4.1a Extreme NYADV Readings Watch, NYADV too low means the selling pressure is very high so it almost guarantees SPX will have a lower close ahead, in another word is that it will close below 1041.

ExtremeNYADVReadingsWatch 

If you’ve been reading my posts then you probably remember there’s a doubt about whether the 05/25 low is THE LOW because the NYMO positive divergence (see  06/04 Market Recap) is missing. From the chart below we can see, even though SPX had a lower low today but for NYA, it’s still a higher low so there’s still no positive divergence yet. (Why uses NYA? Because NYMO is NYSE McClellan Oscillator not SPX McClellan Oscillator, so officially, NYA should be used to compare with the NYMO to check the divergence. Agree?)

NYMOandMarketBottom 

Here’s a little hint about how the market will go the next. 0.1.2 QQQQ Short-term Trading Signals, QQQQ had a consecutive 7 down days, let’s see in the past what happened thereafter? The chart below are all the other 4 cases since year 2000 when QQQQ had a consecutive 7 down days or more. Looks to me, tomorrow or no later than the day after tomorrow, there might be a rebound, but similar to the reason mentioned for the chart 6.4.1a Extreme NYADV Readings Watch above, the down pressure must be very strong to make QQQQ down 7 days in a row so it’s very rare that QQQQ would be successful on its very first rebound attempt, therefore accordingly, after a short-term rebound, chances are good that at least we’ll see one more leg down.

QQQQDown7Days 

If the above speculation of at least 2 leg down is true, then be careful of the Head and Shoulders Top shown in chart 4.1.0 S&P 500 Large Cap Index (Weekly), once breakdown the price target could be around 861. Of course, now is far from a confirmed break down, so no need to worry for now. Let’s just keep this in mind and wait and see.

SPXWeekly 

SHORT-TERM: COULD SEE REBOUND TOMORROW, NOT SURE AS SEASONALITY IS BEARISH FOR TOMORROW

As mentioned in today’s After Bell Quick Summary, there’re 67% chances a green day tomorrow. However because seasonality (See 06/25 Market Recap) is very bearish for tomorrow while very bullish for Thursday and Friday, so the rebound could be on Thursday instead of tomorrow. Also from chart 6.3.2c Major Distribution Day Watch, if “the tradable bottom is very close” still applies then indeed, Thursday and Friday are promising.

MDDAbove35Watch 

1.1.1 NYSE Composite Index Breadth Watch, see dashed green lines, whenever the NYADV:NYDEC MA(10) above is very low or the NYUPV below is very low, chances are very good that we’ll see a green day the next day. However the chart only reflects what happened in 2009 bull market, so I’m not sure if it applies now although officially we’re still in bull market therefore it should apply shouldn’t it?

NYADaily


HIGHLIGHTS OF THE OTHER ETFS IN MY
PUBLIC CHART LIST
*DTFMS = Dual Time Frame Momentum Strategy. The signal is given when both weekly and daily STO have the same buy/sell signals. Use it as a filter, don’t trade directly.
  TREND *DTFMS COMMENT – *New update. Click BLUE to see chart if link is not provided.
QQQQ UP    0.1.3 Nasdaq 100 Index Intermediate-term Trading Signals: *ChiOsc a little too low.
IWM DOWN   Ascending Broadening Wedge, downward breakout 73% of the time.
CHINA DOWN    
EMERGING UP   *SELL  
EUROPEAN UP    
CANADA *DOWN SELL  
BOND UP BUY Breakout but ChiOsc is way too high now.
EURO DOWN    
GOLD UP BUY 4.3.0 Gold Trust Shares (GLD Weekly): Head and Shoulders Bottom, target $129.99.
GDX UP BUY 4.3.1 Market Vectors Gold Miners (GDX Weekly): GDX:$SPX is too high.
OIL UP BUY  
ENERGY *DOWN SELL  
FINANCIALS DOWN BUY  
REITS UP 4.4.3 Real Estate iShares (IYR Weekly): Pay attention to XHB weakness!
MATERIALS UP *SELL

06/29/2010 After Bell Quick Summary

The bottom line, I believe now you may have plenty of indicators screaming for a rebound, well, at least wait for a few days because I have a solid evidence saying that there’s at least one lower close ahead. I think now perhaps fewer people doubt that indeed a NYMO positive divergence is needed in order for the market to form a real bottom, well, too bad, there’s no lower low yet on NYA so officially there’s no positive divergence yet (see 0.2.3 NYSE McClellan Oscillator).

One trick for tomorrow, 31 out of 46 times (67%) a green day the next day after a Major Distribution Day (NYSE Down Volume to NYSE Up Volume Ratio >= 9).

1

Monday, June 28, 2010

06/28/2010 Market Recap: Firework?

  TREND INDICATOR MOMENTUM INDICATOR COMMENT (Click link to see chart)
Long-term 3 of 3 are BUY    
Intermediate 2 of 3 are BUY 5 of 5 are NEUTRAL Non-Stop Model is in BUY mode
Short-term 2 of 2 are SELL 6 of 6 are NEUTRAL SPY ST Model is in BUY mode
GANN DAY MOON/SOLAR CYCLE & TIME FIB CONCLUSION
07/07-07/11 07/11 / 07/07 07/31, 08/20-08/23 Next pivot date: 07/07-07/11
BULLISH 0.2.1 10Y T-Bill Yield: ROC < –9%, so bottomed?
0.2.2 Extreme Put Call Ratio Watch: all 3 ratios are high, so bottomed?
0.2.5 NYSE Total Volume: Spike high, so bottomed?
BEARISH 0.0.2 Combined Intermediate-term Trading Signals: trend line broken, so topped?
6.3.2b Major Distribution Day Watch: 2 MDD within 5 days means an intermediate-term downtrend?
4.1.0 S&P 500 Large Cap Index (Weekly): bearish engulfing were bearish for the next several weeks.
CONCLUSION  
SPY SETUP ENTRY DATE STOP LOSS INSTRUCTION: Mechanic signals, back test is HERE, signals are HERE.
TRADING PLATFORM:
SSO/SDS, UPRO/SPXU
ST Model   *Buy setup wasn’t confirmed therefore is invalid.
Reversal Bar     *Buy setup wasn’t confirmed therefore is invalid.
NYMO Sell    
Non-Stop(RSP) 06/17 L N/A See 06/17 Market Recap for more details.
OTHER ETFs TREND *DTFMS COMMENT – *New update. Click BLUE to see chart if link is not provided.
QQQQ UP  
IWM DOWN BUY Ascending Broadening Wedge, downward breakout 73% of the time.
CHINA DOWN
EMERGING UP  
EUROPEAN UP
CANADA UP *SELL
BOND UP *BUY Breakout but ChiOsc is way too high now.
EURO DOWN BUY
GOLD UP BUY 4.3.0 Gold Trust Shares (GLD Weekly): Head and Shoulders Bottom, target $129.99.
GDX UP BUY 4.3.1 Market Vectors Gold Miners (GDX Weekly): GDX:$SPX is too high.
OIL UP BUY
ENERGY UP *SELL
FINANCIALS DOWN BUY
REITS UP BUY 4.4.3 Real Estate iShares (IYR Weekly): Pay attention to XHB weakness!
MATERIALS UP *BUY

*Please make sure you understand how to use the table above. The main purpose of this report is to provide information so contradictory signals are always presented.
*DTFMS = Dual Time Frame Momentum Strategy. The signal is given when both weekly and daily STO have the same buy/sell signals. Use it as a filter, don’t trade directly.

SEASONALITY: BEARISH MONDAY TO WEDNESDAY, BULLISH THURSDAY AND FRIDAY

See 06/25 Market Recap for more details.

INTERMEDIATE-TERM: THIS WEEK NEUTRUAL, NEXT AND NEXT NEXT WEEK ARE BEARISH

See 06/25 Market Recap for more details.

SHORT-TERM: DIRECTION UNCLEAR BUT BULLISH CPC READINGS MAY MEAN A FIREWORK AHEAD

All I wanted to say are in today’s After Bell Quick Summary, the market dropped again but put call ratio seems bullish therefore we could see some “firework”. Just I don’t know if this “firework setup” originated in 2008 would work this time or not. Besides this, I have nothing else to say. The short-term direction is not clear, could be a Symmetrical Triangle in the forming which means one more leg down but also could be a Head and Shoulders Bottom in the forming which means a rebound. We have to wait until tomorrow to see in which direction the market will breakout. Either way, the move will be big, so buckle your belt!

SPY15min

06/28/2010 After Bell Quick Summary

About today’s trick, I have no idea if it still works or not because some commented before that during the 2009 bull market, a 70% plus winning rate for predicting an up day the next day is nothing which I partially agree. But the trick was originated in 2008 bear market, so it’s still hard to say if it works or not. Anyway, whether it works or not, I don’t care, as I’ve explained in the weekend’s report,  the purpose of this quick summary is to provide you with some information, it doesn’t represent my view of the market which are usually no better than clueless.

When CPC <= 0.81, 41 out of 59 times (69%), a green day the next day.

3

The story about CPC < 0.8 was originated in 2008 when I found interestingly whenever CPC < 0.8, the market would soon skyrocketed high for a few days and then fell to the ground hard which I named it as a “firework” trading setup. Some old readers should remember this.

1

The setup evolved into more complex one in 2009 bull market but gradually became meaningless because in most cases the market simply was up and up, there’s no bullish setup needed anymore. And that’s why I didn’t bother to mention it anymore.

2

The purpose I’m telling this story is to let you know the option market behavior today was very strange. Contrary to what says in many books, the put call ratio is actually a leading indicator, a sudden drop in put call ratio like we saw today may mean big guys know some good news ahead of our retailers and are preparing for the celebration. So bears be careful here, although personally, I don’t trade on such kind of story or speculation but it’s no harm to be prepared.

Sunday, June 27, 2010

06/25/2010 Market Recap: Weekly Bearish Engulfing

  TREND INDICATOR MOMENTUM INDICATOR COMMENT (Click link to see chart)
Long-term 3 of 3 are BUY    
Intermediate 2 of 3 are BUY 5 of 5 are NEUTRAL Non-Stop Model is in BUY mode
Short-term 2 of 2 are SELL 6 of 6 are NEUTRAL SPY ST Model is in BUY mode
GANN DAY MOON/SOLAR CYCLE & TIME FIB CONCLUSION
07/07-07/11 06/26 / 07/07 07/31, 08/20-08/23 Next pivot date: 07/07?
BULLISH 0.2.1 10Y T-Bill Yield: ROC < –9%, so bottomed?
0.2.2 Extreme Put Call Ratio Watch: all 3 ratios are high, so bottomed?
*0.2.5 NYSE Total Volume: Spike high, so bottomed?
BEARISH 0.0.2 Combined Intermediate-term Trading Signals: trend line broken, so topped?
6.3.2b Major Distribution Day Watch: 2 MDD within 5 days means an intermediate-term downtrend?
*4.1.0 S&P 500 Large Cap Index (Weekly): bearish engulfing were bearish for the next several weeks.
CONCLUSION  
SPY SETUP ENTRY DATE STOP LOSS INSTRUCTION: Mechanic signals, back test is HERE, signals are HERE.
TRADING PLATFORM:
SSO/SDS, UPRO/SPXU
ST Model   *Long if SPY up next Monday. The stop loss will be 1.9*ATR(10).
Reversal Bar     *Long if SPY up next Monday. The stop loss will be 0.9*ATR(10).
NYMO Sell    
Non-Stop(RSP) 06/17 L N/A See 06/17 Market Recap for more details.
OTHER ETFs TREND *DTFMS COMMENT – *New update. Click BLUE to see chart if link is not provided.
QQQQ UP  
IWM DOWN *BUY Ascending Broadening Wedge, downward breakout 73% of the time.
CHINA DOWN
EMERGING UP  
EUROPEAN UP *BUY
CANADA UP  
BOND UP   ChiOsc is way too high now.
EURO DOWN BUY
GOLD UP *BUY 4.3.0 Gold Trust Shares (GLD Weekly): Head and Shoulders Bottom, target $129.99.
GDX UP *BUY 4.3.1 Market Vectors Gold Miners (GDX Weekly): GDX:$SPX is too high.
OIL UP *BUY
ENERGY UP  
FINANCIALS DOWN *BUY
REITS UP *BUY *4.4.3 Real Estate iShares (IYR Weekly): Pay attention to XHB weakness!
MATERIALS UP  

*Please make sure you understand how to use the table above. The main purpose of this report is to provide information so contradictory signals are always presented.
*DTFMS = Dual Time Frame Momentum Strategy. The signal is given when both weekly and daily STO have the same buy/sell signals. Use it as a filter, don’t trade directly.

SEASONALITY: BEARISH MONDAY TO WEDNESDAY, BULLISH THURSDAY AND FRIDAY

According to Stock Trader’s Almanac:

  1. Last day of Q2 bearish for Dow, down 13 of last 18 but bullish for Nasdaq, up 12 of 17, although down 4 in a row.
  2. First trading day in July, Dow up 17 of last 20.

6.5.2b Month Day Seasonality Watch, the last 2 trading day of recent month are bearish, but the 3rd last trading day, i.e. next Monday, could be bullish.

MonthDaySeasonality 

The chart below shows the seasonality around the Independence Day. Just want to remind you: the market closed on 07/05.

holiday_independence 

So to summarize above, looks to me the Thursday and Friday next week are bullish.

INTERMEDIATE-TERM: NEXT WEEK NEUTRUAL, NEXT NEXT AND NEXT NEXT NEXT WEEK ARE BEARISH

As mentioned in 06/24 Market Recap, officially the intermediate-term trend is up because I don’t argue with my SPY ST Model which now is still in BUY mode. But as explained in the 06/21 Market Recap, lacking of secondary buy signals should keep you from on the long side, therefore till now, even I kept saying that officially the trend is up while the market kept dropping everyday, you should lose no intermediate-term positions.

By the way, I simply provide info in my daily After Bell Quick Summary, those tricks don’t represent my view of the market. For example, this week, the tricks were apparently bullish biased, but no matter what I think, I have to tell you whatever I see. In no circumstance, should I tell you, this time may be different. It’s up to you to decide. I’m a believer of there’s no 100% correct Holly Grail in the trading world. In order to win in the long run, I must always bet on the side that proves to have higher odds RELIGIOUSLY. If every time I see something, I always say maybe this time is different, then virtually no indicators, no statistics are needed, to trade, the only thing matters is what I FEEL. Well, I don’t believe this is how I should trade. Anyway, even tricks didn’t work good this week, but don’t forget in 06/18 Market Recap, I said clearly, this week would very likely be a red week. And for the next day’s speculation in everyday’s After Bell Quick Summary, I was still right on Monday and Friday. So again it’s not that bad as it feels, statistics still matters.

Well, back to where we are, officially the intermediate-term trend is up, but in 06/24 Market Recap, I mentioned 3 potential top signs:

  1. 0.0.2 Combined Intermediate-term Trading Signals, CPCE trend line broken may mean a top.
  2. 6.3.2b Major Distribution Day Watch, 2 Major Distribution Day within 5 days means a short-term rebound but most likely confirming an intermediate-term down trend.
  3. 4.1.0 S&P 500 Large Cap Index (Weekly), weekly bearish engulfing.

SPXWeekly 

The chart below is a simple back test about a weekly bearish engulfing since 1988. Sell short at the Friday’s close, cover at close 1 week, 2 week, 3 week, 4 week, 5 week and 6 week later at close since 1988. Looks to me the next week is neutral, but week 2, 3 and 4 are not so bull friendly.

WeeklyEngulfing 

So to summarize above, all I can say are, intermediate-term doesn’t look bright, but officially it’s not a confirmed down yet. When to confirm? I’ve discussed this in the 06/22 After Bell Quick Summary. Yes, when the trend is finally confirmed down, it’d be too late but it’s a sad reality. For right now, bulls still have a little hope:

  1. 1.4.1 iShares MSCI Emerging Markets (EEM Daily)
  2. 1.4.2 Vanguard European VIPERs (VGK Daily)
  3. 3.1.0 Currency Shares Euro Trust (FXE Daily)
  4. 3.3.0 United States Oil Fund, LP (USO Daily) 

Emerging markets, European markets, Euro, Australian Dollar and oil all held well. Those guys usually lead the US market.

EEMDaily 

4.0.5 The World Market, this chart should clearly show why I said that EEM leads the market. Believe or not, EEM is an very important leading indicator. See HERE for reasoning behind it if interested.

EEMandWLSH 

So, although at the current stage, the intermediate-term doesn’t look bright, but still bulls are not dead yet. A Spinning Top formed on SPY daily chart this Friday could be a potential reversal bar (50% chances). A green Monday would trigger the SPY ST Model and Reversal Bar Model buy setup which I’ve discussed in the 06/23 Market Recap, if indeed they’re confirmed, bulls will have 67% chances.

SPYShortTerm 

SHORT-TERM: COULD SEE GREEN MONDAY BUT BE CAREFUL OF NASDAQ INTRADY CUMULATIVE TICK

I’ve mentioned 2 reasons in the Friday’s After Bell Quick Summary for a green Monday. I know they’re not convincing at all but here I finally managed to find the 3rd “EXCUSE”: QQQQ down 5 days in a row, buy at close, sell at the next day close since 2002, looks like not bad for bulls the next Monday.

LongWhenQQQQDown5Days

6.3.2b Major Distribution Day Watch, I’ve discussed this in 06/24 Market Recap, 2 Major Distribution Day within 5 days although means an intermediate-term down trend but a short-term rebound usually could be expected. Here is the back test from Quantifiable Edges: Two 90% Down Days In One Week backing my idea.

So to summarize above, very short-term, bulls have hopes, but in the Friday’s After Bell Quick Summary, I said I’m going to WOW here. The previous 8 WOWs were in 06/02 Market Recap, 05/26 Market Recap, 05/18 Market Recap, 05/12 Market Recap, 05/03 Market Recap, 04/29 Market Recap, 04/20 Market Recap and 04/14 Market Recap, the market all had a bigger pullback no later than the next Tuesday, so be careful. Personally, I still think the extremely high readings in the sentimentrader’s Nasdaq Intraday Cumulative TICK chart simply means a change in trading characters, not because people are too much in love with Nasdaq stocks. I think you can clearly see this in the chart below, the Friday’s WOW now is within a recent NORMAL range even shouldn’t be counted as a WOW now because it’s still not higher than the solid red line above. Well, of course, I don’t mean to ignore this chart, I simply want to say that don’t treat WOW as bear’s Holly Grail like people in my forum do.

IntradayCumTick

Disclaimer

The information contained on this website and from any communication related to the author’s blog and chartbook is for information purposes only. The chart analysis and the market recap do not hold out as providing any financial, legal, investment, or other advice. In addition, no suggestion or advice is offered regarding the nature, profitability, suitability, sustainability of any particular trading practice or investment strategy. The materials on this website do not constitute offer or advice and you should not rely on the information here to make or refrain from making any decision or take or refrain from taking any action. It is up to the visitors to make their own decisions, or to consult with a registered professional financial advisor.

This websites provides third-party websites for your convenience but the author does not endorse, approve, or certify the information on other websites, nor does the author take responsibility for a part or all materials on the third-party websites which are not maintained by the author.