Live Update

Tuesday, December 30, 2008

12/30/2008 Market Recap: Time Running Out

Two problems today:

1. Intra-day chart has overbought readings, so market might open lower or pullback in the morning tomorrow.

2. Down 5 days, up 4 days (well, sort of), so according to my "equal up down days" rule, market must up huge tomorrow. This seems a little difficult. Well, because for the past 4 up days, there was a day traded for only half day, so maybe it's OK as long as the high of 1/2/2009 is higher than the high of 12/17/2008. But anyway in order to meet the goal, tomorrow, the market shouldn't drop huge, should it?


0.0.0 Signal Watch and Daily Highlights, it's the time to take at least partial profits if you follow short-term signals in this chart. I may not mention this every time in my report, so you have to check this chart everyday.


For "equal up down day" rule, please compare the following chart with 8.1.1 Buyable Pullback Rule. The market MUST UP BIG within 2 trading days.

NYADaily BuyablePullbackRule

0.0.2 SPY Short-term Trading Signals, 2 overbought readings.

SPYShortTerm

1.0.3 S&P 500 SPDRs (SPY 30 min), be careful about RSI "Double" overbought.

SPY30min

1.0.4 S&P 500 SPDRs (SPY 15 min), lots of overbought readings, MACD RSI negative divergence (a little though), possible Bearish Rising Wedge.

SPY15min


1.4.2 S&P/TSX Composite Index (60 min), 1.4.4 TSE McClellan Oscillator, Canada overbought too.

Monday, December 29, 2008

12/29/2008 Market Recap: Guppy Multiple Moving Average

Not much to say today, light volume, no direction. Tomorrow, the market might open lower or pullback in the morning. Noticed that recently the market tends to open high, sell off most of the day and pump up before the close, so if the market opens high again I suspect if it will sell off again, otherwise it seems too easy for bears.


0.0.0 Signal Watch and Daily Highlights, I've re-grouped the signals, now we have short-term buy/sell signals. The basic idea is to long when there's a buy signal, take partial profit when overbought signals appear and close long take short when there's a sell signal. Well, since they're mechanical signals which tend to have whipsaws, so you have to decide by yourself whether to trust these signals.

SignalWatch

1.0.4 S&P 500 SPDRs (SPY 15 min), STO and TICK overbought so that's why I said the market might open low or have a pullback in the morning. For bulls, although MACD, RSI positive divergence may look good but be prepared for the potential "Descending Triangle" breakdown.

SPY15min

Guppy Multiple Moving Average, the long term moving averages in pink represent huge overhead resistance (the wider between each pink line the heavier the resistance), the short term moving averages in brown have tried twice to break these pink lines but the pink lines remain almost intact (no sign of contracting which means the resistance is weakening). So it's quite understandable the sideway actions of the current market as the overhead resistance is too heavy. Comparing this with what had happened in August, where even the pink lines were not as thick as those of now, still after six tries in vain to break them, the brown lines had to give up. What I'm trying to say here is, it takes significant buying in order for the market to go up and unfortunately so far till now, I don't see those buying. So bulls, be patient and be prepared for the worst.

SP500GMMA

Sunday, December 28, 2008

12/26/2008 Market Recap: Mixed Signals

Very thin volume Friday, so the Friday's market action may mean nothing. However the fact that the market has been up for 2 days in a row but still couldn't recover the previous 1 day drop, may mean that bears have the up hand. Now bulls must, for the rest of 3 days in 2008, fully recover the previous 5 down days. It seems a little difficult to me. 2.8.1 CBOE Options Total Put/Call Ratio has pointed a market top while 2.3.4 Nasdaq Total Volume/NYSE Total Volume still yells a market bottom, I don't know which one is telling the truth, just let the market come to us: SPX breaks above 920 then intermediate-term up, breaks bellow 850 then intermediate-term down. Monday, because the Energy sector might rebound, so the overall market has a chance to go up.


8.1.2 Does extremely low CPC lead a market top?, because the extreme values of CPC vary in different period, "Normalized CPC" is used, which is the distance between MA10 and MA200. From the chart we can see, in bear market, 100% chances, an extremely low CPC value led to a market top.

CPC 

8.0.1 Use NATV/NYTV to catch the market top/bottom, pay attention to the dashed green lines, still for "Normalized NATV:NYTV", the current low readings, 100% chances, mean a market bottom.

NATVvsNYTV

Oh, one hint: almost everyone uses CPC to check the market top/bottom while it seems I'm the only one who uses NATV:NYTV to check the market top/bottom.


0.0.2 SPY Short-term Trading Signals, could be a Bull Flag, plus a low reading on STO, short-term bulls still have chances.

SPYShortTerm

1.0.4 S&P 500 SPDRs (SPY 15 min), possible Ascending Triangle, so might close green again on Monday. However, because the overbought readings on STO and TICK, the market might open low or pullback in the morning.

SPY15min

3.4.1 United States Oil Fund, LP (USO Daily), as mentioned in the previous report, the current position of RSI and STO usually mean a few days bounce.

USODaily

5.2.0 Energy Select Sector SPDR (XLE Daily), STO and ChiOsc indicate a potential bounce and since the energy sector weights heavily in the SPX, so as long as the financial sector doesn't drop too much, the overall market will go up.

XLEDaily

Thursday, December 25, 2008

12/24/2008 Market Recap: An interesting chart

Nothing to say, just want to show you an interesting chart. Courtesy of http://www.stocktiming.com/index.htm.

The char shows that for the first time since May, the institution buy exceeds the institution sell. And recently the institution buy has decreased while the institution sell has increased a little. I'll keep an eye on this chart and report to you as soon as there're any interesting developments.

instell

Tuesday, December 23, 2008

Merry Christmas!

Thank you, my dear readers, Merry Christmas!

Christmas Presents

12/23/2008 Market Recap: No Santa Rally

Well, no Santa Rally this year, I was wrong. (For statistics about Santa Rally, check here: http://quantifiableedges.blogspot.com/2008/12/twas-3-nights-before-christmas.html) Still down 5 days in a row, no lower low, chart 8.1.1 Buyable Pullback Rule still applies. Well, maybe you don't believe me anymore, but I'll stick to my plan until SPX 850 was broken on close basis. Tomorrow we'll have only half trading day and plus a usually very low volume post Christmas Friday, so whatever going to happen might mean nothing. And by the way, one of paid newsletters I subscribe began to short the market today, reason, the Rising Wedge was broken yesterday.


0.0.0 Signal Watch and Daily Highlights, for overall signals, short-term a little oversold, not very significant though.

SignalWatch

 1.0.3 S&P 500 SPDRs (SPY 30 min), RSI and STO not oversold yet, so this may mean that the market still has rooms to drop. Why SPX 850 ($84.51 on SPY chart) important? Besides it's the first lower low, if broken, a Double Top might be formed with target around $77.

SPY30min

 2.0.0 Volatility Index (Daily), ENV 10 still indicates an oversold condition. I still don't know how this going to affect the market.

 2.8.1 CBOE Options Total Put/Call Ratio, still way too bullish.

 3.4.1 United States Oil Fund, LP (USO Daily), oversold. Pay attention to the green dashed lines, whenever RSI and STO reach certain oversold level at the same time, USO always had a several days bounce. Hope this time it works again. Recently the market seems to fluctuate along with the price of the oil, so if USO can bounce, maybe it's good for the overall market.

USODaily

Monday, December 22, 2008

12/22/2008 Market Recap: Down 4 days in a row

During the past seven days there are five days when the market went down but there is still no low low, so the bounce still alive, and 8.1.1 Buyable Pullback Rule is still valid.  TA is a matter of probability, and I validated all signals that I present in the report and they worked in the past, which is by no means guaranteed to work 100% accurate in the time being.  If the signals are wrong, I will cut loss when SPX closes below 850.  On the following chart, you may study if the rule in 8.1.1 is still valid.  Because all short-term signals are neutral, I have no idea whether the market will go up or down.  I guess the probability of going further down is low, because it's rare to see five consecutive down days even in this year.  Again, it's a matter of probability and I would like to avoid saying "this time might be different".

image

1.0.3 S&P 500 SPDRs (SPY 30 min), a little bit positive divergence.  RSI and STO could go further up assuming they bounced back up from oversold level, so it's possible that the market could rally as soon as it opens, further down is also possible and that will form a low low, and RSI will form higher low.  The so called rebound after positive divergence means the market goes down in the morning and reverses during the day.

image

2.8.1 CBOE Options Total Put/Call Ratio.  This signal is way too bullish.  However according to my observation the market may not sell off immediately after CPC reaches very low, and it could go up for a few days, which can be seen on the green curves represented by the market at the locations of green vertical dashed lines.

image 

2.0.0 Volatility Index (Daily).  VIX is still oversold, and it is going down with the market, now I am unclear what the consequence is.

image

Sunday, December 21, 2008

12/19/2008 Market Recap: Down 3 days in a row

Although SPX went up a bit on Friday, SPY dropped down.  On the chart, three down days didn't take off the rally on Tuesday, so the dip is a buy according to 8.1.1 Buyable Pullback Rule.  Suppose anything unexpected happens, the cut loss is below Dec 12th low at about 850.  And the last hope of bulls is below the Dec 1st low at about 815.  There is no concrete sign to indicate whether the market goes up or down on Monday, and my guess is the probability of 4 down days is pretty low since there are only two cases of three down days in a row since Oct 10th, and INDU and NYA have been down for three days.  Furthermore, the next two weeks are shorter than normal, so will be the volume, if the big moneys want to distribute they won't get a good price, so the probability of big selling off is very low.

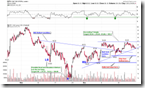
Take a look at the following SPY 60-min chart, the chart pattern looks quite bullish, SPX broke the head and shoulders bottom and then back tested neckline, finally it took off and formed an ascending triangle.  Ascending triangle usually means continuation, and the probability of going up is higher.  Of course it could break out at the downside, in this case there are two important levels where you can either cut loss or short the market.

image

7.0.3 NYSE Composite Index Breadth Watch.  The Friday down is actually not very weak, the breadth is positive.  This circumstance is the first time during the recent several months.  Additionally, 1.3.7 Russell 3000 Dominant Price-Volume Relationships, surprisingly, 1443 stocks price up volume up, which is the most bullish among four price-volume relationships.  The conclusion is no conclusion, just interesting.

image

2.0.0 Volatility Index (Daily).  This chart could be either bullish or bearish from different perspectives.  It is oversold, and ENV20 is almost broken, so VIX might bounce back up in the short term which favors bears.  However the big pictures is that double top is confirmed -- because the neckline is not very clear, it might not be broken strictly speaking.  My thought is bullish, according to my experience once a pattern is broken the overbought/oversold signals will not matter and VIX may continuously drop down.

image

2.3.4 Nasdaq Total Volume/NYSE Total Volume.  This looks bullish to bulls, but it should not be over-considered because Friday was option expiry day.

image

Here is T2123 of Telechart, which is the accumulation of 4 week new high - 4 week new low and reflects the market strength.  Although the market dropped down for three days but green line was going up, which indicates that 4 there were more and more week high.  One can also see that the market is decent when green line crosses above the brown lines.  Compare with up-crossing in August, the brown line is very close, and the rally was over very soon.

image

Here is analysis from a few newsletters.

Based on awarded Money Stream and TSV, Don Worden in Telechart is optimistic to the market.

image

Analysis of Mian Line Investor:

image

Analysis of Arthur Hill:

image

VIX analysis by Mike Paulenoff:

image

Thursday, December 18, 2008

12/18/2008 Market Recap: 2 down days in a row finally

Today it's the first time the market went down for two days in a row in December.  However according to 8.1.1 Buyable Pullback Rule, this dip was a buy because two down days failed to take off the rally on Tuesday, which means bears are weaker.  On SPX daily chart, surprisingly there is only one time the market down for three days since Oct 10th, this means the probability of market down tomorrow is relatively small.  On the intraday chart of SPY, both RSI and STO are very close to oversold, therefore even if the market doesn't bounce back up tomorrow morning, it could do so during the day.  However the breadth is a bit overbought or close to overbought, so it's prudent to lock the profit should the market rallies substantially.

Evidences to support the bounce back tomorrow morning:

1.0.3 S&P 500 SPDRs (SPY 30 min), from the RSI and STO I think that even if the market goes further down it should not be significant.  If the rebound doesn't happen in the morning, it could do afterward.

image

1.0.4 S&P 500 SPDRs (SPY 15 min).  RSI on the 15-min chart was extremely oversold once a while, which means the downside space is limited, and the rebound will be either morning or the afternoon.

image

Why it's better to lock the profit if the market goes up substantially:

0.0.2 SPY Short-term Trading Signals, ascending triangle or rising wedge is not broken yet, good.  NYMO is still very close to overbought level, and STO on the top is not far from the overbought region.  You may refer to 2.0.0 Volatility Index (Daily) to see how VIX is oversold.

image

2.0.0 Volatility Index (Daily).  Previously I mentioned that it is not a big deal VIX breaks out ENV10 at the downside, however it will be an extreme case if ENV20 denoted by the red curves gets broken.  Note that VIX is not far from ENV20.  If VIX drops down tomorrow, the pattern could be a confirmed double top, which is a good news to the market over the intermediate term.  However in the short term it would be extremely oversold, and the market could pull back in the short term.

image

T2122 of Telechart is going up continuously today.  If the market soars up tomorrow, it could go to overbought region, which means the market would pull back in the short term.

image

SPX Climactic Volume Indicator (CVI), all overbought indicators have been corrected.

image

Wednesday, December 17, 2008

12/17/2008 Market Recap: Consolidation Day

Today is a consolidation day, and the direction is undecided.  There is no technical indicator to predict whether the market will go up or down tomorrow.  I guess the correction could continue in the morning but finally the market would close in green.  The reason is that there has been no two consecutive down days since December.  In term of operation, because the short-term breadth signals are a bit overbought or nearly overbought, it's better to lock the profit should the market rally substantially.

Over the intermediate term, my signals are based on 0.0.3 SPX Intermediate-term Trading Signals.  Since it's all buy signals and no obvious negative divergence, so the strategy is to buy dip according to 8.1.1 Buyable Pullback Rule.  In the short term, do not consider to short unless you are very sure, for instance, there were several accurate signals yesterday, and the short positions should be hold for hedge the intermediate term long positions because the mid-term signals are often time-delayed, as soon as the signals are confirmed much profit has gone already.

0.0.2 SPY Short-term Trading Signals.  It's very likely an ascending triangle, and the upper edge has been tested six times, and I guess the breakout will be at the up side.  Note the two short term overbought signals, VIX ENV may not mean anything, but NYMO is fairly accurate.  Of course it is not very high today, but it will be if the market rallies further.

image

The T2122 of Telechart, NYSE 4 week New High / Low Ratio, is a bit high.  If it reaches the blue line at the top, the probability of short-term pullback is quite high.

image

Here is the SPX Cimactic Volume Indicator (CVI) chart.  If the market rallies it may go back to overbought region.

image

Some readers reminded me yesterday that, major accumulation day on 1.0.5 Major Accumulation/Distribution Days, break down symmetrical triangle on 2.0.0 Volatility Index (Daily), and major indices closed above 50-day moving averages for the first time, which are all bullish signs.  I didn't mentioned those because they didn't reflect the major signals during the day.  Today there are several other interesting charts, 3.0.3 20 Year Treasury Bond Fund iShares (TLT Daily), overbought, 3.1.0 US Dollar Index (Daily), oversold, 3.2.0 CurrencyShares Japanese Yen Trust (FXY Daily), overbought (it may not be an important signal later as mentioned yesterday); 3.2.3 US Dollar/Japanese Yen Ratio, this shows that it's no longer valid to use Yen to predict the direction of the stock market.

Tuesday, December 16, 2008

Another proof of a possible pullback tomorrow

Well, I just saw another proof of a possible pullback tomorrow. Courtesy of www.decisionpoint.com.


Pay attention to SPX Climactic Volume Indicator (CVI), maybe the right side "Last 21 days" is clearer. CVI is too high, and it seems like every time CVI reaches the today's level, the next day will close in red.

CVI

12/16/2008 Market Recap: No Breakout Yet

Are bulls happy today? Well, technically, not out of the woods yet, as still no higher high today and intermediate-term still could be a Bearish Rising Wedge in the forming. Tomorrow, because RSI on SPX 30 min and 15 min char are pretty overbought, plus extreme readings on TICK, so the market may at least have either a morning or an intraday pullback.


0.0.2 SPY Short-term Trading Signals, the question of Ascending Triangle or Rising Wedge still not resolved. VIX ENV close to oversold and NYMO overbought so if again rise big tomorrow, bulls better take some profits.

SPYShortTerm

1.0.3 S&P 500 SPDRs (SPY 30 min), RSI overbought and the blue curve of the TICK is a little bit too high, so a pullback is due.

SPY30min

1.0.4 S&P 500 SPDRs (SPY 15 min), RSI way too overbought and ChiOsc is at the level which generally is not sustainable.

SPY15min


3.2.0 CurrencyShares Japanese Yen Trust (FXY Daily), Yen had a big day today, it's a good news for the stock market as Yen is overbought and therefore due for a pullback. 3.2.4 Japanese Yen and the Market Top/Bottom, if have time, take a look at this chart, it is probably still applicable that RSI of Yen overbought means a market bottom. But, since the interest rate of US$ is almost zero now, I'm not sure if "Carry Trade" should become meaningless and therefore the Yen can no longer be used as a market indicator. We will see.

FXYDaily

Monday, December 15, 2008

12/15/2008 Market Recap: No Title

No much to talk about today.  Tomorrow is a Fed day, so no idea what will happen, probably big swings again after 2:15pm.

Let's take a look a few charts.

0.0.2 SPY Short-term Trading Signals.  Today SPX falls right at the lower edge of the rising wedge (or the ascending triangle).  Inside day, maybe the market is waiting too.

image

1.0.3 S&P 500 SPDRs (SPY 30 min).  Note the level of TICK represented by the blue curves on the top of chart.  At such a level, I have sufficient reasons to doubt how deep it could drop down in any case the market plunged.

image

3.2.0 CurrencyShares Japanese Yen Trust (FXY Daily).  Japanese Yen is showing the same thing, three black candles in a row which likely causes reversal in normal circumstance.

image

Sunday, December 14, 2008

12/12/2008 Market Recap: Bearish Until Proven Bullish

This week bears almost attacked for four days but couldn't take off the gain of previous two days, so bulls won.  In the week it is bulls' turn to prove themselves.  On the chart there are a few patterns against bulls, although these are not destructive but bulls have to break out before disregarding these patterns.  Therefore it is key whether the market could rally substantially in the next week.  On Monday, since the TICK is a bit extreme the market could pull back during the trading hours if the market doesn't open at low.

Over the intermediate term, there are several patterns which worry me:

0.0.2 SPY Short-term Trading Signals.  It could be a bearish rising wedge, or possibly a ascending triangle.  So a breakout is needed to give us a clear picture.  VIX ENV is close to oversold, and NYMO is nearly overbought, so you should lock profit if the market closes significantly higher on Monday.

image

2.0.0 Volatility Index (Daily).  It might be a symmetrical triangle, which means 75% of chance is break out at the upside.  Furthermore, VIX is nearly oversold and will bounce back up sooner or later, which means the market will pull back.

image

3.0.3 20 Year Treasury Bond Fund iShares (TLT Daily).  This looks like an ascending triangle.  The massive rally is really a concern.

image

The evidences to support short-term pullback:

1.0.3 S&P 500 SPDRs (SPY 30 min).  Take a look at TICK, note the level of blue lines is a bit high.  Previously the blue lines pulled back moderately at this level, and it's not far from big pullback.  Therefore I suggest to lock profit should big rally happens.

image

1.0.4 S&P 500 SPDRs (SPY 15 min).  It looks like back testing broken descending triangle.  RSI and ChiOsc are at a subtle levels and they could pull back.

image

1.3.7 Russell 3000 Dominant Price-Volume Relationships, 1388 stocks price up volume down, bearish.

The following is a single good news in this report, but it has a higher weight.

3.2.1 Japanese Yen (Weekly), overbought, and more importantly it has gone up for six weeks.  3.2.0 CurrencyShares Japanese Yen Trust (FXY Daily), take a look at this chart also, two black candles which have a high probability of reversal, period.

image

Disclaimer

The information contained on this website and from any communication related to the author’s blog and chartbook is for information purposes only. The chart analysis and the market recap do not hold out as providing any financial, legal, investment, or other advice. In addition, no suggestion or advice is offered regarding the nature, profitability, suitability, sustainability of any particular trading practice or investment strategy. The materials on this website do not constitute offer or advice and you should not rely on the information here to make or refrain from making any decision or take or refrain from taking any action. It is up to the visitors to make their own decisions, or to consult with a registered professional financial advisor.

This websites provides third-party websites for your convenience but the author does not endorse, approve, or certify the information on other websites, nor does the author take responsibility for a part or all materials on the third-party websites which are not maintained by the author.