Live Update

Saturday, July 31, 2010

07/30/2010 Market Recap: The Rebound Could be Over or Very Close

  TREND MOMENTUM COMMENT
Long-term 1 of 2 are SELL    
Intermediate 2 of 3 are BUY 5 of 5 are NEUTRAL SPY ST Model in BUY mode; Non-Stop in BUY mode
Short-term Model is SELL 5 of 5 are NEUTRAL Trend is down but I hold no short over the weekend.
GANN DAY MOON/SOLAR CYCLE CONCLUSION
8/6,8/11,8/26 08/09 / 08/08 8/2,8/9,8/11,8/23 Next pivot date: 08/09 – 08/11, 08/23 – 08/26
BULLISH 0.2.1 10Y T-Bill Yield: ROC(30) < –9, so market bottomed?
BEARISH 0.0.2 Combined Intermediate-term Trading Signals: Trend line broken, so market topped?
SPY SETUP ENTRY DATE STOP LOSS INSTRUCTION: Mechanic signals, back test is HERE, signals are HERE.
TRADING PLATFORM:
SSO/SDS, UPRO/SPXU
Non-Stop 07/15 L N/A Be sure to check 8.2.2a to 8.2.2g to understand the risks.
ST Model 07/20 L Breakeven
*Please make sure you understand how to use the table above. The main purpose of this report is to provide information so contradictory signals are always presented.

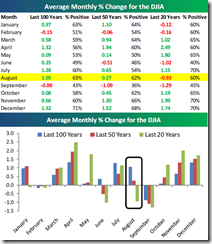
SEASONALITY: THE FIRST NINE TRADING DAYS OF AUGUST ARE HISTORICALLY WEAK

According to the Stock Trader’s Almanac:

  1. First trading day in August, Dow down 9 of last 12.
  2. First nine trading days of August are historically weak.

The chart below is from Bespoke.

AvgMonthlyChange 

The chart below is from sentimentrader.

AugSeasonality 

INTERMEDIATE-TERM: THE CORRECTION SINCE 04/26 ISN’T OVER, THE REBOUND SINCE 07/01 IS OVER OR CLOSE

The bottom line:

  1. The correction since 04/26 is not over.
  2. The rebound since 07/01 could be over or very close to be over. The thing I’m not sure is whether there still will be a new recovery high (higher than 07/01 high) ahead.

Why isn’t the correction since 04/26 over?

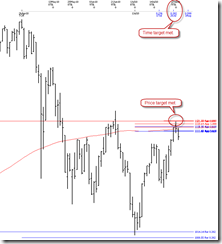
Firstly, the correction time is not enough. See chart below. I mentioned that the mini mini correction time is Fib 23.6% from 03/06/2009 low to 04/26/2010 high which is on 08/02. However, now chances are pretty low that the 08/02 low is lower than the 07/01 low or at least equal, so apparently the 08/02 is not the low. While if the 07/01 low is the low, then the correction time is way too short. So if the Fib 23.6% on 08/02 is not the low then the next Fib 38.2% at 10/02 should be the only logic time when the correction could be over. Right?

PivotDateAnalysis 

Secondly, the rebound since 07/01 is much much weaker comparing with the last year. It doesn’t look like that a new bull has kicked in. The chart below should be self explanatory enough.

WeakerRebound

Why could the rebound since 07/01 be over? The chart below should also be self explanatory enough. It’s a little bit complicated to do the back test, so I did a visual back test. It looks to me, since year 2000, if SPX made a higher high then had a very first 3 down days in a row, 70% to 80% chances it led to a little little bit bigger correction. Besides, don’t forget the August seasonality is not very bull friendly especially the very first 9 trading days.

PullbackBeganWith3ConsecutiveDownDays 

If indeed we have a little little bit bigger correction ahead, will it test the 07/01 low? Well, I don’t know yet.

By the way, in the time analysis chart above, I also listed lots of potential pivot dates, such as 08/02, 08/06, 08/09, 08/11, 08/16, 08/23, 08/26. They all have multiple sources from different angles to back them as important dates. For now I have no clue yet on how the market will react to those pivot dates. Just listed here for your early references. Personally, I think the 08/09 to 08/11 and 08/23 to 08/26 are the 2 most important time windows.

SHORT-TERM: MIXED SINGALS FOR THE NEXT MONDAY, I’M A LITTLE BIT BEARISH BIASED THOUGH

In the Friday’s After Bell Quick Summary, I mentioned that chances are good we’ll see a green Monday. However from the 2 new evidences below, looks like bears may have a little little little little bit better chances:

Long up shadow in 60 min chart doesn’t look good.

LongUpShadowWatch 

SPY fell only 2 cents on Friday but TNX dropped more 3%, as you all know that TNX generally leads SPX so this could hardly be a good news. Short at Friday’s close then cover at Monday close since year 2000, you have 72% chances。

SPYUpTNXDown3Percent 

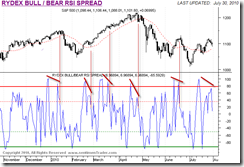
The charts below are all from sentimentrader. The Rydex (retailer) traders are very bullish and AAII (also retailers) are not bearish at all. Info only, because I certainly don’t want to see someone comments again (happened a lot in my forum) saying because retailers are way too bearish so the market will rise huge.

RydexRSISpreadRyedBetaChaseIndexAAII


HIGHLIGHTS OF THE OTHER ETFS IN MY PUBLIC CHART LIST
  TREND COMMENT – *New update. Click BLUE to see chart if link is not provided.
QQQQ UP 4.1.1 Nasdaq 100 Index (Weekly): Bearish 1-2-3 formation, target 1565.
IWM UP
CHINA UP
EMERGING UP 4.1.6 iShares MSCI Emerging Markets (EEM Weekly): Bear Flag?; EEM:$SPX too high.
EUROPEAN UP 4.1.7 Vanguard European VIPERs (VGK Weekly): Bearish 1-2-3 formation, target $35.45; Bear Flag?
CANADA DOWN 4.1.5 iShares CDN S&P/TSX 60 Index Fund (XIU.TO Weekly): Bearish 1-2-3 formation, target $15.30.
BOND UP
EURO UP
GOLD DOWN
GDX DOWN
OIL UP 4.4.0 United States Oil Fund, LP (USO Weekly): Bear Flag?
ENERGY UP 4.4.1 Energy Select Sector SPDR (XLE Weekly): Bearish 1-2-3 formation, target $43.14.
FINANCIALS DOWN
REITS UP
MATERIALS UP

Friday, July 30, 2010

07/30/2010 After Bell Quick Summary

The bottom line, today’s market action is encouraging although officially my short-term model (Hmm, you didn’t see the model? Then you didn’t pay attention to my table. It’s not the SPY ST Model, it’s something else) has yet confirmed an uptrend. Perhaps a green Monday will coax it into believing so. So the question is: Are we going to have a green Monday? Well, at least I have 2 tricks saying so.

When SPY down 4 days in a row (Yes, spy closed in red today), buy at today’s close sell at the first green day at close, you’ll have 82% chances since year 2000.

3

When CPC <= 0.81, 43 out of 62 times (69%) recently a green day the next day.

1

Enjoy your weekend!

P.S. In case you wanted to know: No, today is NOT an All Up Day. $USD missed 5 points, see 6.4.9 All Up Day Watch.

Thursday, July 29, 2010

07/29/2010 Market Recap: Kiss Channel Goodbye?

  TREND MOMENTUM COMMENT
Long-term 1 of 2 are SELL    
Intermediate 3 of 3 are BUY 5 of 5 are NEUTRAL SPY ST Model in BUY mode; Non-Stop in BUY mode
Short-term Model is SELL 5 of 5 are NEUTRAL Re-shorted on 07/29, hold overnight as the mini target is not met, not because it’s safe to hold overnight.
GANN DAY MOON/SOLAR CYCLE CONCLUSION
07/27 07/25 / 07/23 07/26, 07/31, 08/02 Next pivot date: 07/26 – 08/03
BULLISH 0.2.1 10Y T-Bill Yield: ROC(30) < –9, so market bottomed?
BEARISH 0.0.2 Combined Intermediate-term Trading Signals: Trend line broken, so market topped?
SPY SETUP ENTRY DATE STOP LOSS INSTRUCTION: Mechanic signals, back test is HERE, signals are HERE.
TRADING PLATFORM:
SSO/SDS, UPRO/SPXU
Non-Stop 07/15 L N/A Be sure to check 8.2.2a to 8.2.2g to understand the risks.
ST Model 07/20 L Breakeven
*Please make sure you understand how to use the table above. The main purpose of this report is to provide information so contradictory signals are always presented.

SEASONALITY: THE LAST TRADING WEEK OF RECENT MONTH WAS GENERALLY BEARISH

See 07/23 Market Recap for more details.

INTERMEDIATE-TERM: KEY WEEK THIS WEEK

Key week this week, as multiple pivot dates are due until 08/03. The market may turn down on any of those pivot dates to at least test the 07/01 low. However if the market simply keeps rising during this time window, then most likely the same March 2010 mad cow is back. See 07/23 Market Recap for more details.

SHORT-TERM: A LITTLE BIT BEARISH BIASED

I see more bearish signals than bullish signals but none of them are decisive, so all I can say now are: I’m bearish biased, especially if you look at the chart 1.0.0 S&P 500 SPDRs (SPY 60 min), could be a breakdown then kiss channel goodbye so the market may resume the pullback tomorrow.

SPY60min

So far SPY had 2 bearish reversal days (open high then higher high but eventually close in red) within 3 days. Short at today’s close, cover 3 days later since year 2000 (plus 2 additional conditions: RSI(2) 3 days ago  > 75 and MA(20) up meaning the reversal days happened on an uptrend) , looks like bears have some edges.

2ReversalDaysIn3Days 

If you take a look at the SPY daily for what happened after all the dates listed in the chart above, you also could see those dates at least were very close to a short-term top. The chart below shows the most recent 5 cases (highlighted in red).

BearishReversalDaysVisualBackTest 

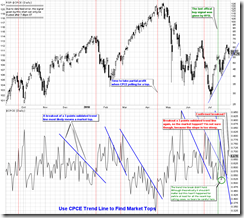
This is just to follow up the top signal I mentioned yesterday: 0.0.2 Combined Intermediate-term Trading Signals, looks like the trend line breakout was confirmed today.

CPCEWatch 


HIGHLIGHTS OF THE OTHER ETFS IN MY PUBLIC CHART LIST
  TREND COMMENT – *New update. Click BLUE to see chart if link is not provided.
QQQQ UP 4.1.1 Nasdaq 100 Index (Weekly): Bearish 1-2-3 formation, target 1565.
IWM UP
CHINA UP
EMERGING UP 4.1.6 iShares MSCI Emerging Markets (EEM Weekly): Bear Flag?; EEM:$SPX too high.
EUROPEAN UP 4.1.7 Vanguard European VIPERs (VGK Weekly): Bearish 1-2-3 formation, target $35.45; Bear Flag?
CANADA DOWN 4.1.5 iShares CDN S&P/TSX 60 Index Fund (XIU.TO Weekly): Bearish 1-2-3 formation, target $15.30.
BOND UP
EURO UP
GOLD DOWN
GDX DOWN
OIL UP 4.4.0 United States Oil Fund, LP (USO Weekly): Bear Flag?
ENERGY UP 4.4.1 Energy Select Sector SPDR (XLE Weekly): Bearish 1-2-3 formation, target $43.14.
FINANCIALS DOWN
REITS UP
MATERIALS UP

07/29/2010 After Bell Quick Summary

The bottom line, the short-term trend is down.

The SPY daily chart doesn’t look good with two bearish reversal bars (open high close in red) within 3 days.  But bears still need to seal the deal tomorrow because if we get yet another huge gap up tomorrow morning, that’d be the 3rd time huge gap up in 4 days which should be very unlikely to be sold off again as the 3rd time is the charm.

One trick for tomorrow, when both VIX and SPX closed in red, 25 out of 36 times (69%) a green day the next day.

2

Wednesday, July 28, 2010

07/28/2010 Market Recap: Bull Flag?

  TREND MOMENTUM COMMENT
Long-term 1 of 2 are SELL    
Intermediate 3 of 3 are BUY 5 of 5 are NEUTRAL SPY ST Model in BUY mode; Non-Stop in BUY mode
Short-term Model is SELL 5 of 5 are NEUTRAL Short on 07/28, hold overnight as the mini target is not met, not because it’s safe to hold overnight.
GANN DAY MOON/SOLAR CYCLE CONCLUSION
07/27 07/25 / 07/23 07/26, 07/31, 08/02 Next pivot date: 07/26 – 08/03
BULLISH *0.2.1 10Y T-Bill Yield: ROC(30) < –9, so market bottomed?
BEARISH *0.0.2 Combined Intermediate-term Trading Signals: Trend line broken, so market topped?
SPY SETUP ENTRY DATE STOP LOSS INSTRUCTION: Mechanic signals, back test is HERE, signals are HERE.
TRADING PLATFORM:
SSO/SDS, UPRO/SPXU
Non-Stop 07/15 L N/A Be sure to check 8.2.2a to 8.2.2g to understand the risks.
ST Model 07/20 L Breakeven
*Please make sure you understand how to use the table above. The main purpose of this report is to provide information so contradictory signals are always presented.

SEASONALITY: THE LAST TRADING WEEK OF RECENT MONTH WAS GENERALLY BEARISH

See 07/23 Market Recap for more details.

INTERMEDIATE-TERM: KEY WEEK THIS WEEK

Key week this week, as multiple pivot dates are due until 08/03. The market may turn down on any of those pivot dates to at least test the 07/01 low. However if the market simply keeps rising during this time window, then most likely the same March 2010 mad cow is back. See 07/23 Market Recap for more details.

SHORT-TERM: DIRECTION NOT CLEAR, A LITTLE BIT BULLISH BIASED THOUGH

Mixed signals, so the short-term direction is not clear, need see tomorrow.

Bears have two hopes:

  1. Seasonality. See today’s After Bell Quick Summary for more details.
  2. Pivot price and date were met, so the market should turn down and the down size should not be small (See 07/26 Market Recap). As mentioned in the 07/23 Market Recap, this week is an important test for my pivot date forecast skill, because theoretically 07/27 is a perfect turning point. However, I’m not confident about my pivot date forecast skill or to be precise, not confident about the pivot price and date theory yet.

PriceAndTimeTarget

The bulls’ hope is that the pullback today showed no urgency therefore didn’t look like a start of the 2nd leg down to test the 07/01 low. Instead a Bull Flag could be in the forming. And with the help of the price channel support, chances are pretty good that we may see a rebound tomorrow.

SPY60min 

The charts below are little bit bear friendly but neither are perfect so I won’t read too much into them.

6.4.3a SPY Bearish Reversal Day Watch. I mentioned this chart in yesterday’s report, claiming 2 failed bearish reversal days in a row were rare, so as expected we did see a red day today. See chart below, now only the bearish reversal day with a follow through red day cases are left on the chart. As we can see that 7 out of 10 times a red day the next day since March 2009 bull market. However the longer history back test doesn’t show any edge for bears. And this is why I won’t read too much into it.

BearishReversalDayWatch 

0.0.2 Combined Intermediate-term Trading Signals, 3 points validated trend line was broken today therefore arguing for a market top. However, for a perfect top signal, bears need see the trend line held tomorrow. Besides the trend line is a little bit too steep so I’m not sure the validity of this signal.

CPCEWatch 


HIGHLIGHTS OF THE OTHER ETFS IN MY PUBLIC CHART LIST
  TREND COMMENT – *New update. Click BLUE to see chart if link is not provided.
QQQQ UP 4.1.1 Nasdaq 100 Index (Weekly): Bearish 1-2-3 formation, target 1565.
IWM UP
CHINA UP
EMERGING UP 4.1.6 iShares MSCI Emerging Markets (EEM Weekly): Bear Flag?; EEM:$SPX too high.
EUROPEAN UP 4.1.7 Vanguard European VIPERs (VGK Weekly): Bearish 1-2-3 formation, target $35.45; Bear Flag?
CANADA DOWN 4.1.5 iShares CDN S&P/TSX 60 Index Fund (XIU.TO Weekly): Bearish 1-2-3 formation, target $15.30.
BOND UP
EURO UP
GOLD DOWN 4.3.0 Gold Trust Shares (GLD Weekly): Head and Shoulders Bottom, target $129.99.
GDX DOWN
OIL UP 4.4.0 United States Oil Fund, LP (USO Weekly): Bear Flag?
ENERGY UP 4.4.1 Energy Select Sector SPDR (XLE Weekly): Bearish 1-2-3 formation, target $43.14.
FINANCIALS DOWN
REITS UP
MATERIALS UP

07/28/2010 After Bell Quick Summary

The bottom line, the short-term trend is down but not confirmed yet.

Has the 2nd leg down to test the 07/01 low started? I have no idea. Because except for those pivot dates arguing for a top, I have no other evidences. Right now it seems the 07/27 pivot date was right on time, but ironically, I don’t remember when my pivot date was EXACTLY on time, so from contrarian point of view, the 07/27 may not be THE TOP. But on the contrarian contrarian point of view, for having so many pivot dates not exactly on time, maybe this time I got lucky? LOL

For tomorrow and the day after tomorrow, let’s see if the seasonality chart below plays out again or not this time.

1

By the way, the price volume negative divergence setup I mentioned in 07/26 After Bell Quick Summary, surprisingly, it worked again. It looks like a very bad setup, but the winning rate actually is not that bad. The reason I mention it is maybe (I’m not sure) this could be the evidence to support the short-term trend is down argument I made above.

2

Tuesday, July 27, 2010

07/27/2010 Market Recap: Key Day Tomorrow

  TREND MOMENTUM COMMENT
Long-term 1 of 2 are SELL    
Intermediate 3 of 3 are BUY 5 of 5 are NEUTRAL SPY ST Model in BUY mode; Non-Stop in BUY mode
Short-term Model is BUY 3 of 5 are OVERBOUGHT Long on 07/23, hold partial overnight.
GANN DAY MOON/SOLAR CYCLE CONCLUSION
07/27 07/25 / 07/23 07/26, 07/31, 08/02 Next pivot date: 07/26 – 08/03
BULLISH
BEARISH 0.2.3 NYSE McClellan Oscillator: Overbought.
T2122 overbought.
SPY SETUP ENTRY DATE STOP LOSS INSTRUCTION: Mechanic signals, back test is HERE, signals are HERE.
TRADING PLATFORM:
SSO/SDS, UPRO/SPXU
Non-Stop 07/15 L N/A Be sure to check 8.2.2a to 8.2.2g to understand the risks.
ST Model 07/20 L Breakeven
*Please make sure you understand how to use the table above. The main purpose of this report is to provide information so contradictory signals are always presented.

SEASONALITY: THE LAST TRADING WEEK OF RECENT MONTH WAS GENERALLY BEARISH

See 07/23 Market Recap for more details.

INTERMEDIATE-TERM: KEY WEEK THIS WEEK

Key week this week, as multiple pivot dates are due until 08/03. The market may turn down on any of those pivot dates to at least test the 07/01 low. However if the market simply keeps rising during this time window, then most likely the same March 2010 mad cow is back. See 07/23 Market Recap for more details.

SHORT-TERM: KEY DAY TOMORROW

Not much to say today, see chart below, if up big tomorrow then mad cow ahead, if Doji or red day tomorrow, then the pullback has already started. As whether the pullback is the start of a 2nd leg down or just a short-term pullback will have to see the strength of the pullback. So let’s wait for tomorrow.

 NYADVWatch

The chart below shows all the Bearish Reversal Days since the March 2009 bull market. Looks to me, there’s never 2 failed Bearish Reversal Days in a row, so be careful.

BearishReversalDay 


HIGHLIGHTS OF THE OTHER ETFS IN MY PUBLIC CHART LIST
  TREND COMMENT – *New update. Click BLUE to see chart if link is not provided.
QQQQ UP 4.1.1 Nasdaq 100 Index (Weekly): Bearish 1-2-3 formation, target 1565.
IWM UP
CHINA UP
EMERGING UP 4.1.6 iShares MSCI Emerging Markets (EEM Weekly): Bear Flag?; EEM:$SPX too high.
EUROPEAN UP 4.1.7 Vanguard European VIPERs (VGK Weekly): Bearish 1-2-3 formation, target $35.45; Bear Flag?
CANADA DOWN 4.1.5 iShares CDN S&P/TSX 60 Index Fund (XIU.TO Weekly): Bearish 1-2-3 formation, target $15.30.
BOND UP
EURO UP
GOLD DOWN 4.3.0 Gold Trust Shares (GLD Weekly): Head and Shoulders Bottom, target $129.99.
GDX DOWN
OIL UP 4.4.0 United States Oil Fund, LP (USO Weekly): Bear Flag?
ENERGY UP 4.4.1 Energy Select Sector SPDR (XLE Weekly): Bearish 1-2-3 formation, target $43.14.
FINANCIALS DOWN
REITS UP
MATERIALS UP

07/27/2010 After Bell Quick Summary

Ugly daily chart as the market opened high then closed in red forming kind of so called bearish reversal day, but who cares anyway, looks to me that many people believe the mad cow is now back, so any bearish signals could be discarded. Well, all I can say now are if this still is a normal market, then a little bit bigger pullback should be imminent.

A little little little little bullish biased toward tomorrow, because seasonality is generally bullish for tomorrow but not so bull friendly after tomorrow and after after tomorrow.

1

Monday, July 26, 2010

07/26/2010 Market Recap: Overbought

  TREND MOMENTUM COMMENT
Long-term 1 of 2 are SELL    
Intermediate 2 of 3 are BUY 5 of 5 are NEUTRAL SPY ST Model in BUY mode; Non-Stop in BUY mode
Short-term Model is BUY 3 of 5 are OVERBOUGHT Long on 07/23, hold partial overnight.
GANN DAY MOON/SOLAR CYCLE CONCLUSION
07/27 07/25 / 07/23 07/26, 07/31, 08/02 Next pivot date: 07/26 – 08/03
BULLISH
BEARISH 0.2.3 NYSE McClellan Oscillator: Overbought.
0.2.6 NYSE - Issues Advancing: Overbought.
*T2122 overbought.
SPY SETUP ENTRY DATE STOP LOSS INSTRUCTION: Mechanic signals, back test is HERE, signals are HERE.
TRADING PLATFORM:
SSO/SDS, UPRO/SPXU
Non-Stop 07/15 L N/A Be sure to check 8.2.2a to 8.2.2g to understand the risks.
ST Model 07/20 L Breakeven
*Please make sure you understand how to use the table above. The main purpose of this report is to provide information so contradictory signals are always presented.

SEASONALITY: THE LAST TRADING WEEK OF RECENT MONTH WAS GENERALLY BEARISH

See 07/23 Market Recap for more details.

INTERMEDIATE-TERM: KEY WEEK THIS WEEK

Key week this week, as multiple pivot dates are due until 08/03. The market may turn down on any of those pivot dates to at least test the 07/01 low. However if the market simply keeps rising during this time window, then most likely the same March 2010 mad cow is back. See 07/23 Market Recap for more details.

SHORT-TERM: EXPECT A PULLBACK AS EARLY AS TOMORROW

Market is overbought now. I know (as I’ve already seen some comments) some people will say overbought could be more overbought. Well, search all my past reports and take a look at what happened within a day or two when I use the word overbought as the title. Because the overbought signals I watch are not common signals, only under very very extreme conditions, will I use the word overbought as the title. And today is one of those very rare occurrences.

I mentioned the price and time target in the 07/23 Market Recap. Today both the initial price and time target are met.

PriceAndTimeTarget 

Price pattern wise, I see clear Bearish Rising Wedge in chart 1.0.1 S&P 500 SPDRs (SPY 15 min).

SPY15min 

So to summarize above, time, price, price pattern and unique signals I watch are all met today, so theoretically, at least a short-term pullback should be very likely. As for whether the pullback, if indeed, means the 2nd leg down I’ve been blah blah in recent reports? I think it may not be likely. However, let’s wait to see how the market pullbacks before discussing this topic further. Because I’d feel very embarrassed if I blah blah a lot today about the coming pullback while in reality the market has no pullback at all.

List below are all the overbought signals I mentioned above. Again, you can see they’re not at all traditional overbought/oversold indicators.

NYADV MA(5). This chart is actually the main reason I said above, if indeed there’s a pullback, it’ll most likely be short lived, a new recovery high should be expected after the pullback.

NYADVWatch 

NYMO.

NYMOWatch 

T2122.

T2122

Intraday Cumulative Tick from sentimentrader. This is the 13th WOW. Except the recent 12th WOW that hasn’t got enough time to show its muscle, for the previous 11 WOWs, the market all had big pullbacks thereafter. The previous 12 WOWs were in 07/22 Market Recap, 07/13 Market Recap, 06/30 Market Recap, 06/25 Market Recap, 06/02 Market Recap, 05/26 Market Recap, 05/18 Market Recap, 05/12 Market Recap, 05/03 Market Recap, 04/29 Market Recap, 04/20 Market Recap and 04/14 Market Recap.

IntradayCumTick 

T2112, NYSE stocks 2 std dev above MA(40). Not very extreme, but prior to the year 2009, today’s reading would be a record high. I think it’s worth watching in the following days.

T2112 


HIGHLIGHTS OF THE OTHER ETFS IN MY PUBLIC CHART LIST
  TREND COMMENT – *New update. Click BLUE to see chart if link is not provided.
QQQQ UP 4.1.1 Nasdaq 100 Index (Weekly): Bearish 1-2-3 formation, target 1565.
IWM UP
CHINA UP
EMERGING UP 4.1.6 iShares MSCI Emerging Markets (EEM Weekly): Bear Flag?; EEM:$SPX too high.
EUROPEAN UP 4.1.7 Vanguard European VIPERs (VGK Weekly): Bearish 1-2-3 formation, target $35.45; Bear Flag?
CANADA DOWN 4.1.5 iShares CDN S&P/TSX 60 Index Fund (XIU.TO Weekly): Bearish 1-2-3 formation, target $15.30.
BOND UP
EURO UP
GOLD DOWN 4.3.0 Gold Trust Shares (GLD Weekly): Head and Shoulders Bottom, target $129.99.
GDX DOWN
OIL UP 4.4.0 United States Oil Fund, LP (USO Weekly): Bear Flag?
ENERGY UP 4.4.1 Energy Select Sector SPDR (XLE Weekly): Bearish 1-2-3 formation, target $43.14.
FINANCIALS DOWN
REITS UP
MATERIALS UP

Disclaimer

The information contained on this website and from any communication related to the author’s blog and chartbook is for information purposes only. The chart analysis and the market recap do not hold out as providing any financial, legal, investment, or other advice. In addition, no suggestion or advice is offered regarding the nature, profitability, suitability, sustainability of any particular trading practice or investment strategy. The materials on this website do not constitute offer or advice and you should not rely on the information here to make or refrain from making any decision or take or refrain from taking any action. It is up to the visitors to make their own decisions, or to consult with a registered professional financial advisor.

This websites provides third-party websites for your convenience but the author does not endorse, approve, or certify the information on other websites, nor does the author take responsibility for a part or all materials on the third-party websites which are not maintained by the author.