Live Update

Monday, August 31, 2009

08/31/2009 Market Recap: Looking at the past patterns

Summary:

Pay attention to a few past patterns, if market behaviors differently this time then the correction may have started.

  Trend Momentum Comments - Sample for using the trend table.
Long-term Up    
Intermediate Up Neutral Further confirmation needed for the intermediate-term buy signals.
Short-term Down* Neutral  
My Emotion Wait   Still think this is a bear market rally.

I see different views about the market direction, some are expecting one last new high while the others say that a bigger correction has started. My suggestion is to look back at a few past patterns to see if they behavior differently this time. And if they do act differently then chances are that a bigger correction has already started.

1. Noticed recently that the market was always down 2 down days in a row then rebounded to a new high. This means the market should rebound tomorrow if the past pattern still works, so if there’s no rebound tomorrow then most likely something different is happening. We should then be careful.

NvsN

2. The intraday pattern today reminds me of the Aug 17, it was also a Monday, opened with big gap down then consolidated the whole day without a further breakdown and then up 4 days in a row to a new high. Also, statistically, if SPX dropped on Friday then opened with a big down gap on next Monday then buying on Monday’s close and held until Wednesday had led to above 90% winning trades. So accordingly if we don’t see rebound or if the SPX Wednesday’s close is less than today’s close then something different is happening. We should then be careful too.

SPY30min

3. Noticed that any bigger pullbacks recently were consisted of 2 gap downs. Today we had the first gap down which means there maybe a 2nd gap down ahead. If so, whether this 2nd gap down could hold or not would help us to identify if a much deeper correction is under way.

SPY60min

Personally, for 2 reasons mentioned on the last Friday’s repot, I maintain the view that at least a short-term top is very close. I will apply the above mentioned 3 patterns to confirm whether my view is correct or not.

SPXandNYMOWatch QQQQShortTerm

08/31/2009 After Bell Quick Summary

I see a little little bit better chances a green close tomorrow for 2 reasons:

Hollow red bar had a slightly better chance to lead a green close next day.

SPYShortTerm

The recent pattern seemed to act unanimously: Down 2 days then shot up to a new high.

NvsN

08/31/2009 Pre-Market Briefing

Gap down open as predicted but still within the recent trading range so pretty good chances the gap will be filled. In case the gap doesn’t get filled within the 1st hour however, if after 10:30am there’s new intraday low then today would be a strong down trend day.

9:33am, dashed line as resistance, so bears might have chance today as long as the resistance remains intact.

SPY15min

Good luck everyone!

Sunday, August 30, 2009

08/28/2009 Market Recap: SPX new high while NYMO below zero

Summary:

Still range bounded.

Market was topped when SPX was at or close to a new high while NYMO was below zero

Black bar on QQQQ daily chart usually means a top is close.

  Trend Momentum Comments - Sample for using the trend table.
Long-term Up    
Intermediate Up Neutral Further confirmation needed for the intermediate-term buy signals.
Short-term Up Neutral  
My Emotion Wait   Still think this is a bear market rally.

Bottom line, the market is still range bounded, the direction is unclear. From chart 0.0.3 SPX Intermediate-term Trading Signals, apparently, SPX was stalled under the Rising Wedge resistance. Whether it could breakout is anybody’s guess. My guess is that SPX might pullback from here.

SPXDaily

The latest report form Elliott Wave International argues that the market might be topped therefore the wave 3 big fall shall begin. One of its reasons for arguing a top is that the text book target C = A * 0.618 is reached. I don’t see most “wave readers” agree with this call, but I have 2 evidences supporting at least a short-term top is very close - they don’t necessarily predict a big fall though.

CFinished

7.0.8 SPX and NYMO Divergence Watch, looks like the market was topped whenever SPX was at (or very close to) a new high while McClellan Oscillator was below zero.

SPXNYMOWatch

1.1.3 QQQQ Short-term Trading Signals, the black bar may mean:  1. Gap down the next day; 2. May very close to a top.

QQQQShortTerm

The last but not the least, let me quote the most recent John Murphy’s market message as the end of this report:

The two up arrows show bond yields turning up three months before stocks in 2009. Both rose together into June when bond yields peaked. The August move to new 2009 highs by stocks, however, hasn't been confirmed by a similar move in bond yields (see falling green line). When two markets are positively correlated, and one of them starts dropping (bond yields), that's usually an early sign that the other one (stocks) may start to drop as well.

20090828002-sc

Friday, August 28, 2009

Use DISQUS as the comment provider

Sorry ladies and gentlemen, for days some people keep harassing  me and I believe there would be more of this kind to happen in the future as this blog grows rapidly. So today I introduced DISQUS system as the comment provider. Although inconvenient as it seems at the very beginning but I believe DISQUS would eventually become one of a few necessities we must have in the Internet world. So sorry for the inconvenience, please take a little extra time to register in DISQUS. And feel free to test the comment below.

I’m not a “stock god”, I made lots of mistakes and will sure make more mistakes. But please in this free world allow me at least a place to express something I believe. I might not as smart as some of you basher and I might not as educated as some of you basher and I might not as experienced as some of you basher, but at least I work very hard day by day, with no leisure, with no weekend, with no holiday and with no vacation. Isn’t this a new world who believes Cinderella? Then why is a working hard soul so hated?

And for the majority of you who support me, all I want to say are thank you, I really appreciate. And I promise I’d make this blog better and better! See you at DISQUS!

08/28/2009 After Bell Quick Summary

I expect a red close next Monday because CPCE closed at 0.56 which by counting the dashed lines on the chart below, means 76% chances a red close the next day.

CBOE CPCE

Enjoy your weekend!

08/28/2009 Pre-Market Briefing

Could be opened above the yesterday’s range but the gap is relatively small, so no idea if it will be filled today or not. If not filled today then this will be the 10th gap on the SPY chart. I know some gaps take years to fill but I simply couldn’t believe that these 10 gaps all need years to get filled as I don’t remember in the past that SPY had these so many gaps.


9:32am, I think there’s a chance that this gap won’t be filled today. General rule of thumb, if the gap not filled and after 10:30am there’s new intraday high then today could be a strong up trend day.

SPY15min

9:54am, bad news for bears. COMPQ and SOX negative divergence is gone.

COMPQDaily

10:34am, ChiOsc too low, SPY could rebound from here.

SPY15min

Thursday, August 27, 2009

08/27/2009 Market Recap: Indecision

Summary:

No conclusion, small body bar formed today could mean either a continuation or reversal.

Expect INDU to pullback soon.

Could be a Bear Flag in the forming on Shanghai Index.

  Trend Momentum Comments - Sample for using the trend table.
Long-term Up    
Intermediate Up Neutral Further confirmation needed for the intermediate-term buy signals.
Short-term Up Neutral  
My Emotion Wait*   Still think this is a bear market rally.

Nothing to say. Small price bars for 4 days in a row indicates an indecision which could mean either a continuation or reversal, so still have to wait for tomorrow. Just, INDU has been up 8 days in a row while the volume kept decreasing in the last 5 days, this is a typical price-volume negative divergence which usually means a pullback, so it’s possible that INDU could pullback as early as tomorrow.

INDUDaily

7.4.5 Shanghai Stock Exchange Composite Index (Daily), just have a look, could be a Bear Flag in the forming so Shanghai index may go down further. How the correction of the Shanghai index going to affect the US stock market is remained to be seen.

SSECDaily

08/27/2009 After Bell Quick Summary

I don’t see any tricks so I have no idea about tomorrow. Today is another cycle end, see cyan vertical line below, so could be a turning point which means a top of some kind (hey, whose tomato is this? Oh, eggs are welcome just don’t throw directly to me… #$@#*%&*@#$$%).

SPY60min

The longer history about cycles on 60 min chart as below, well, didn’t work 100% but still it worked, right? TA is about finding odds and sticking to it for winning on a longer period of time, blah blah blah…

SPXCycle60min

08/27/2009 Pre-Market Briefing

Open flat, another boring day, I guess.

Institutional Buying and Selling Trending from www.stocktiming.com. My view of the chart is that the distribution is at historical low while accumulation has negative divergence, but overall, the institution is still in accumulation mode.

3


Anonymous said...

market is down now. Will it bounce back?

August 27, 2009 10:11 AM

I have no idea. SPY is on an important support now. TRIN actually is not so bearish today.

SPY30min 


10:25am, Here’s a text book target for Symmetrical Triangle. The rebound so far now looks like a consolidation, so still could breakdown…

SPY15min

11:23am, just a reminder, it’s not a broad based selling, financials are strong therefore TRIN is very low now (0.47). So bears, don’t get too excited.

Sector1

Wednesday, August 26, 2009

08/26/2009 Market Recap: Small body bar again

Summary:

No conclusion, small body bar formed today could mean either a continuation or reversal.

US$ could pullback tomorrow.

Oil could rebound tomorrow.

  Trend Momentum Comments - Sample for using the trend table.
Long-term Up    
Intermediate Up Neutral* Further confirmation needed for the intermediate-term buy signals.
Short-term Up Neutral  
My Emotion Up   Still think this is a bear market rally.

Small body bar again, so still no direction. Let’s see tomorrow. Just from my experiences, consolidation with a series of small bars usually breakout twice and the very first breakout could be a false one, so beware.

1.0.3 S&P 500 SPDRs (SPY 30 min), could be a Symmetrical Triangle, just statistically the upside breakout has only 54% chances so it virtually tells nothing about the future direction.

SPY30min

1.1.3 QQQQ Short-term Trading Signals, could be a Bearish Tri Star, just again statistically the downside breakout has only 52% chances so it too doesn’t tell us about the future direction.

QQQQDaily

As mentioned in the After Bell Quick Summary I bet a close green tomorrow because CPCI > 1.55. There’re 2 additional reasons though:

3.1.0 PowerShares DB US Dollar Index Bullish Fund (UUP Daily), black bar, so US$ could pullback which is good for the stock market.

UUPDaily

3.4.1 United States Oil Fund, LP (USO Daily), hollow red bar, so oil could rise which also is good for the stock market.

USODaily

The char below is a longer history view of CPCI, as mentioned in the After Bell Quick Summary, I didn’t see any edges about what would happen next whenever CPCI > 2.0. Well, here’s the chart, see for yourself, maybe someone could deduce a formula out of this chart?

CPCILarge

08/26/2009 After Bell Quick Summary

The most noticeable event today was the CPCI shot to a multi years high at 2.09 which according to the rule I found recently, means very likely a green close tomorrow (counting dashed lines). The reading seems very unusual but I don’t find any edges from the most recent history about what it could mean on a little bit longer term.

CPCI CPCIWatch

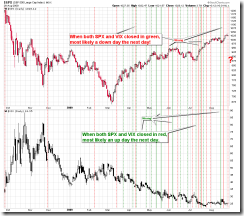
Meanwhile, we have both SPX and VIX closed in green which by counting the red lines in the chart below, 9 out of 13 times recently a red close the next day.

SPXandVIXWatch

Personally I lean toward a green close tomorrow. I’ll present more reasons in tonight’s report. See you there.

08/26/2009 Pre-Market Briefing

Finally, a gap down open would be. A tiny little bit gap down within a recent trading range means it will be filled and the day tends to be flat.

A mail from uempel as some of you know that I respect his opinion. Well again, like all the posts here in this blog, it’s just an opinion I’d like to share (which makes me very happy), but it desn’t mean I agree or disagree.

I believe that one of the most important keys to success is an abundance of patience. Sometimes the charts are contradictory and then it might be just that – to be in cash and to wait for a new short- or long-term trend to establish itself.


I can tell you the story of an American guy I knew who sold all his NASDAQ positions in 1999 and waited 8 months before he went short in March and April 2000. But he’s a well-read savvy investor. He was about 65 years old at the time and he knew he could easily make a few hundred percent by shorting the NASDAQ – and he had the necessary patience to wait for the right moment. His moment to pounce was the drying up of all the liquidity Greenspan had put into the markets (in order to avoid the markets from faltering because of computer glitches at the transition 1999/2000). When the Fed started to close the liquidity taps in January/Februar 2000 the guy knew it was time to act.


Well, this guy prepared his moves very, very carefully. I did not quite understand him at the time. But in the end his handling of the situation was absolutely superb. His trading also impressed other people, and some hedge fund wanted him as an advisor, but I think he was not interested. I have lost track of him now, because a mutual friend is no longer in business and lives elsewhere.


Bottom line: I guess the key to making money on the stock-market is to know when to be out of the market. You might miss a move of 10% or even 20%, but you can be pretty sure to catch the next move...

Tuesday, August 25, 2009

08/25/2009 Market Recap: Small body bar

Summary:

No conclusion, small body bar formed today could mean a continuation or reversal.

Could be a Head and Shoulders Bottom formed on the TLT daily chart.

Zweig Breadth Thrust is overbought.

  Trend Momentum Comments - Sample for using the trend table.
Long-term Up    
Intermediate Up* Overbought* Further confirmation needed for the intermediate-term buy signals.
Short-term Up Neutral  
My Emotion Up   Still think this is a bear market rally.

0.0.2 SPY Short-term Trading Signals, the small body bar formed today could mean either continuation or reversal, need to see tomorrow.  Please refer to 7.2.0 Small Body Bar Trading Rule for more discussions about small body bar.

SPYShortTerm SmallBarTradingRule

0.0.3 SPX Intermediate-term Trading Signals, SPX was rejected again under the Bearish Rising Wedge resistance line. Although there’re lots of negative divergences, but since buy signals were triggered by MACD and NYSI, so today I upgraded the intermediate-term to buy from sell.

SPXMidTerm

7.0.A Major Accumulation Day Watch, as being discussed recently, according to the past pattern if the SPX wasn’t down 2 days in a row then odds are that the uptrend would continue. Just, by comparing with all the dashed green lines, the follow-through we had in the past 2 days after last Friday’s Major Accumulation Day was weak. A similar case was marked with blue cycle on the chart for your references.

MADWatch

Bottom line, I have no evidence to prove that the market is topped while short-term I need to see how market unfolds tomorrow.

Two interesting charts for your info only:

3.0.3 20 Year Treasury Bond Fund iShares (TLT Daily), could be a Head and Shoulders Bottom in the forming.

TLTDaily

T2103 Zweig Breadth Thrust from Telechart, overbought.

T2103

08/25/2009 After Bell Quick Summary

I have no idea about tomorrow because I don’t see any tricks I’ve been using so far for the last couple of weeks.

Four points for you to consider:

  • SPY opened with an up gap for 4 days in a row. What about the 5th day?
  • From the today and yesterday’s market actions, looks to me that it’s very difficult for SPY to hold the 10th up gap. Both gaps were filled intraday.
  • Tomorrow will be the end of a 13 trading day cycle (purple vertical lines), so could potentially be a turning point.

SPY60min

  • Seasonality wise, tomorrow is the 2nd most bullish day in Aug.

Seasonality

08/25/2009 Pre-Market Briefing

Gap up open could be but within yesterday’s range, so very likely the gap will be filled.

Liquidity Inflows and Outflows from www.stocktiming.com

Liquidity inflows are critical to the market's action.   If indicators are weakening while Liquidity is flowing in, then the liquidity inflow will take precedence and hold the market up.   Liquidity inflows had a slight down tick again while in extreme high territory.

2

Well, too much liquidity there, even more, it’s free, so should very difficult for the market to drop…

Monday, August 24, 2009

08/24/2009 Market Recap: Head and Shoulders Top or Bullish Falling Wedge?

Summary:

Key day for bears according to what happened in the past the 2nd day after a Major Accumulation Day.

Could be Head and Shoulders Top or Bullish Falling Wedge in the forming.

SPX daily stopped right at the Bearish Rising Wedge resistance line.

  Trend Momentum Comments - Sample for using the trend table.
Long-term Up    
Intermediate Down Neutral Intermediate sell signals still need further confirmation.
Short-term Up Neutral  
My Emotion Up    

7.0.A Major Accumulation Day Watch, as discussed in the weekend report, down 2 days in a row after a Major Accumulation Day usually means a tradable top (See dashed red lines), so tomorrow is very important for bears.

MADWatch

Simply from the chart pattern point of view, very likely the open tomorrow would determine the fate of bulls and bears. 1.0.3 S&P 500 SPDRs (SPY 30 min), a gap down open, then probably a Head and Shoulders Top is in the play. 1.0.4 S&P 500 SPDRs (SPY 15 min), a gap up open, then could be a Bullish Rising Wedge in the play.

SPY30min SPY15min

Right now, looks like bears have a little edge. Because, firstly, as mentioned in the After Bell Quick Summary, whenever CPCE <= 0.56, most likely a red close the next day, and secondly, SPY has been opened with an up gap for 3 days in a row, so logically the chances for it to open with yet another up gap the 4th time is relatively low.

0.0.3 SPX Intermediate-term Trading Signals, just want your attention to this chart, SPX was rejected right at the Bearish Rising Wedge resistance line, and the whole chart has lots of negative divergences, which I still have difficulties in seeing it as bullish (so again forgive my bearish bias, as I swear I’m only telling the truth… LOL)

SPXDaily

08/24/2009 After Bell Quick Summary

I expect a red close tomorrow because CPCE was closed at 0.54. Counting the dashed lines on the following chart, the odds are high a red close next day whenever CPCE was closed below 0.56.

CBOE CPCE

Please note that my winning rate for predicting the next day’s close ever since the first After Bell Quick Summary was posted (around June) on this blog was above 70% EXCLUDING OE WEEK. If OE week was counted however, the winning rate is just above 60%.

Disclaimer

The information contained on this website and from any communication related to the author’s blog and chartbook is for information purposes only. The chart analysis and the market recap do not hold out as providing any financial, legal, investment, or other advice. In addition, no suggestion or advice is offered regarding the nature, profitability, suitability, sustainability of any particular trading practice or investment strategy. The materials on this website do not constitute offer or advice and you should not rely on the information here to make or refrain from making any decision or take or refrain from taking any action. It is up to the visitors to make their own decisions, or to consult with a registered professional financial advisor.

This websites provides third-party websites for your convenience but the author does not endorse, approve, or certify the information on other websites, nor does the author take responsibility for a part or all materials on the third-party websites which are not maintained by the author.