Market is overbought and due for pullback. My trading rule is that, as I said before, no taking new long positions when the market is overbought. If the market keeps going up and overbought, I watch. Again, this is a matter of probability, and I do not take chance of the low probability of that the market could be overbought and deeper overbought. If you wonder why the market didn't bounce back when it kept oversold a few days ago, you may read the chart 1.0.0 S&P 500 Large Cap Index (Daily) and notice that the market haven't gone down for three consecutive down days except for those three days just prior to the big V-turn. On the other hand, so far we have seen six up days on 0.0.1 Simple SPY Trading System. Well, there is no market in this world which goes up only and never pulls back.
0.0.1 Simple SPY Trading System. Today it is a Bearish Shooting Star pattern, considering those overbought signals, the setup is a possible short-term short. If we do not see a red candle to confirm the setup, we'd better wait. Note the NYSI signal of mid-term long, as I said yesterday, it is your decision to initiate the long position in the morning or wait for the pullback like me. I have had long positions for hedging, so I do not rush besides aforementioned reason (no new long when overbought).

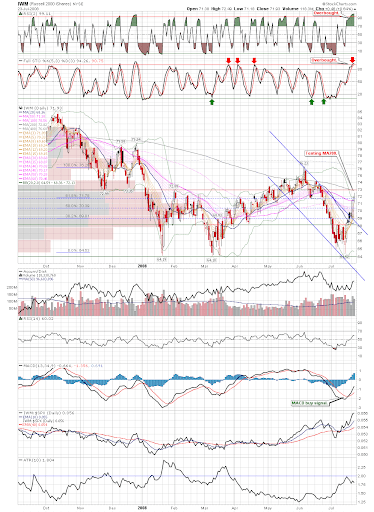
1.3.0 Russell 2000 iShares (IWM Daily). It has gone up for six consecutive days and retraced to Fib 61.8. MA(200) is being tested at the moment.
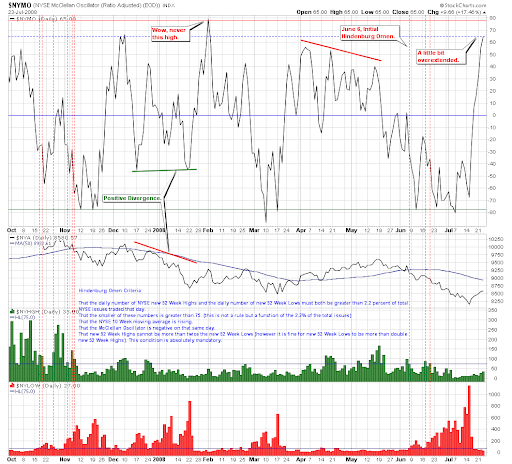
2.2.1 NYSE McClellan Oscillator. Another overbought signal today, and the position is pretty high.
3.4.1 United States Oil Fund, LP (USO Daily). The oil has retraced to Fib 38.2. At the moment it is unclear where the target is.

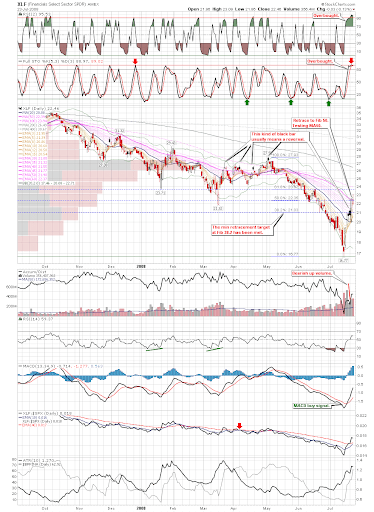
5.3.0 Financials Select Sector SPDR (XLF Daily). It failed to test MA(50) line and formed a reversal candle. Within such a short period of six days, it has reclaimed the loss in the past two months. How amazing it is!
0 comments:
Post a Comment