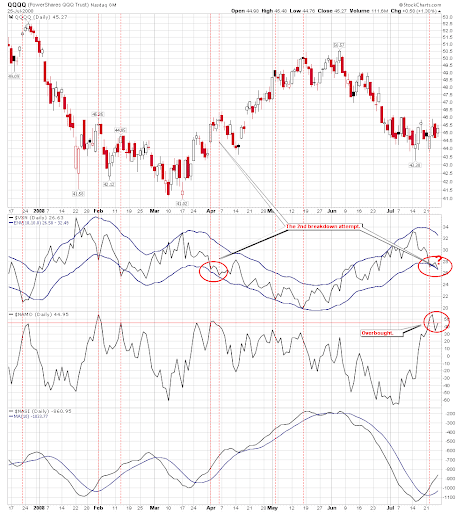
1.1.B QQQQ and VXN. Based on the NAMO indicator COMPQ is overbought. VXN has not gone out of the oversold region, and it actually looks like a double bottom which also formed in the begining of April. So I don't think QQQQ has a tradable upside space.
Concerning the broad market $SPX, the CPC at the bottom of 2.8.0 CBOE Options Equity Put/Call Ratio is 0.83 at the Friday market close, which is quite close to widely-used market top value 0.8. In other words, the market is too bullish, not bearish, and I don't think $SPX will start a big rally from this point.

3.1.0 US Dollar Index (Daily). Spinning Top and then Doji. I don't consider it as a consolidation pattern, maybe it's likely a reversal one considered that STO has reversed after meeting the resistance line.

On the weekly chart 3.1.1 US Dollar Index (Weekly) apparently the Bear Flag has broken downward, and now it's testing back the breakout point. RSI on the top of chart seems unable to penetrate 50, which is a typical sign of USD bear market. USD seems getting resistance and having reversed downward at 74.31. The overall picture is breakdown, bounce back, breakdown, bounce back, now breakdown again, and got lower low. So USD is bearish.

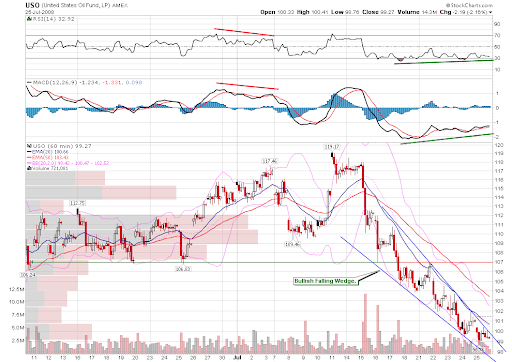
3.4.3 United States Oil Fund, LP (USO 60 min). On the chart USO seems being ready to fight back. Note the Bullish Rising Wedge as well as the positive divergence of MACD and RSI indicators.
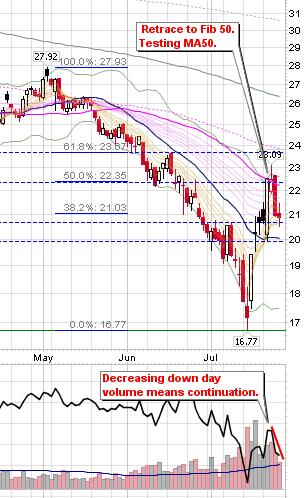
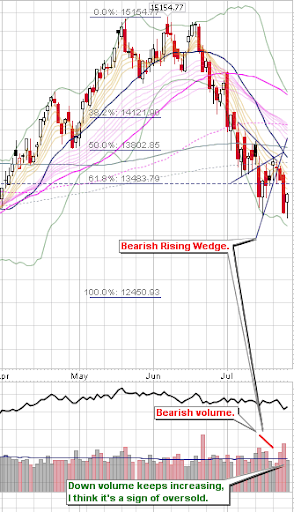
5.3.0 Financials Select Sector SPDR (XLF Daily) is bulls' big hope, however the volume is shrinking during three days of dropping, which is a continuation pattern of the downtrend. Note that price down volume down is not bullish, as I said before. If one day the volume spikes as the price goes down, that will be a sign of trend reversal. If you remember in my Thursday report I said Canada market 1.4.0 S&P/TSX Composite Index (Daily) would bounce back. The reason is that the volume kept increasing. Again, all I said is a matter of probability, and there are exceptions. Anyway, these volume patterns are fairly popular.
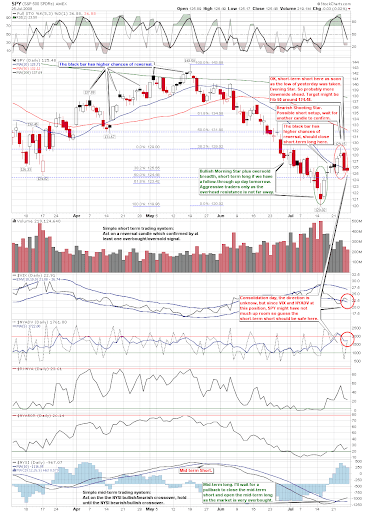
0.0.1 Simple SPY Trading System. VIX is a bit low and might go out of MA(10) Envelop. NYADV on the other hand is a bit high and might go oversold. Therefore I don't think short-term short is risky. My target is still Fib 50.
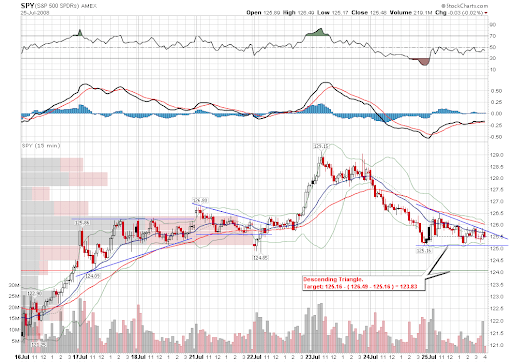
On 1.0.7 S&P 500 SPDRs (SPY 15 min) you can see that the target of the Descending Triangle is about 124.
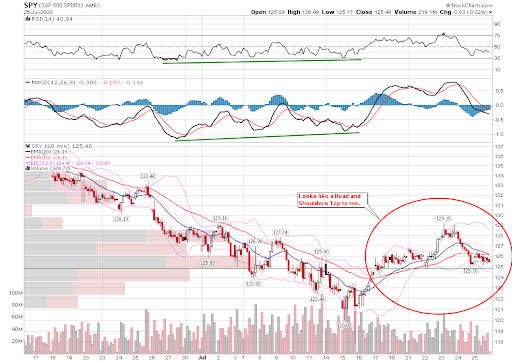
On 1.0.5 S&P 500 SPDRs (SPY 60 min) we cannot rule out the possibility of Head and Shoulders Top.
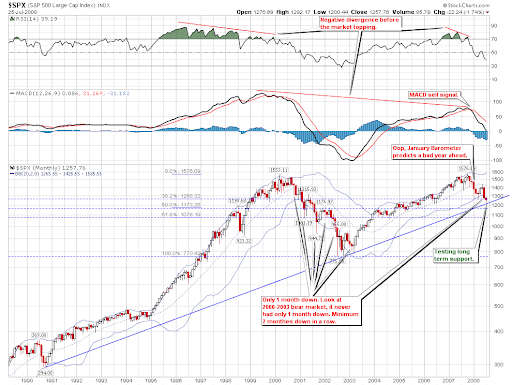
1.0.2 S&P 500 Large Cap Index (Monthly). July will be over after four trading days. In the bear market -- hopefully no one has different opinion -- the drop of SPX always lasted more than one month. Therefore the candle of July is most likely another red bar.
1.1.A PowerShares QQQ Trust (QQQQ 15 min). Bearish Rising Wedge.
1.2.7 Diamonds (DIA 15 min). Descending Triangle.
1.3.6 Russell 2000 iShares (IWM 15 min). Descending Triangle.
3.3.2 streetTRACKS Gold Trust Shares (GLD 60 min). Isn't it a Bearish Rising Wedge? A Head and Shoulders Top seems forming. I am not sure if the gold will rally significantly but it looks like a merely technical rebound considered that the volume Friday slipped down when the price went up on the daily chart 3.3.0 streetTRACKS Gold Trust Shares (GLD Daily).

By the way, on 1.3.7 Russell 3000 Dominant Price-Volume Relationships 1293 stocks were price up volume down on Friday. You may read from the chart that the pattern of recent rallies are mostly price up volume down. In my opinion, this is bearish.
The conclusion is that the pullback is not over yet, and the excuse of further pullback might be the bounce back of commodity. Whether it will be bullish or bearish after the pullback, at the moment I tend to long and hold it to next overbought after this pullback gets oversold. If the market goes up without pullback first, it won't reach too high because it may be overbought easily. Therefore you can think about to short if the market goes up.
enjoy your analysis. Have used it over the past month to make some nice green. Expect the market to
ReplyDeleteopen monday a bit green and will short. The 15's and 60's should kick in after the first 1/2 half or so of trading.
I really enjoy this blog and your analysis. I found you since you have stocktradingtogo.com in your blogroll and if you are interested in a job opportunity please email me.
ReplyDeleteblain@stocktradingtogo.com
Keep up the great work.