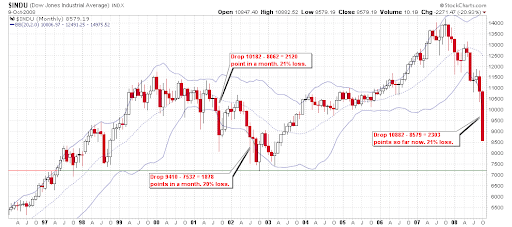
The market dropped almost like a free fall, which is totally out of my expectation. Today I nearly believed that this time might be indeed different until I checked the monthly chart of major indices and calculated the declining in the worst months in 2001 and 2002. I hope the following chart could let you feel better. What I want to say is that the history will repeat and it is ultimately important to be patient no matter you hold any position or not.
Here is an excerpt from a blog(http://www.thekirkreport.com/2008/10/the-stock-marke.html), which is helpful in my opinion:
They say you have to listen to the message of the market and that message today is to run for your life. Every business in America is going bankrupt and taking you, your financial future, job, savings, and everything you know with it. If you believe that, you should have been selling everything today. I don't, which is why I'm going to the mattresses and fighting the good fight every single day. Sure, the battle scars are starting to get numerous and even I am having a difficult time staying opportunistic, but everything I've worked for and learned over the past twenty years has prepared me for what we're seeing now. My only hope is that I stay up to the challenge and hold true to my strategy even though like everyone else, I'd very much like to run for my life and sell & short everything in sight.
2.4.2 NYSE - Issues Advancing. NYADV is still a higher low today. Therefore the hope isn't gone.

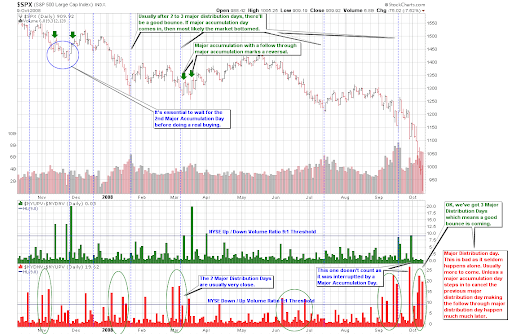
1.0.5 Major Accumulation/Distribution Days. Today is the third Major Distribution Day. According to the history there will be a decent rally after three major distribution days. However note that last time the rally came after four major distribution days. So it is not the time to be optimistic yet.
1.1.4 PowerShares QQQ Trust (QQQQ 60 min). Among all major indices only QQQQ shows a piece of hope. It is still in a bullish falling wedge, and MACD and RSI show positive divergence as well.

2.0.0 Volatility Index (Daily). The chart says today is not the bottom, but STO has reached a level where a reversal happened several times in the past.

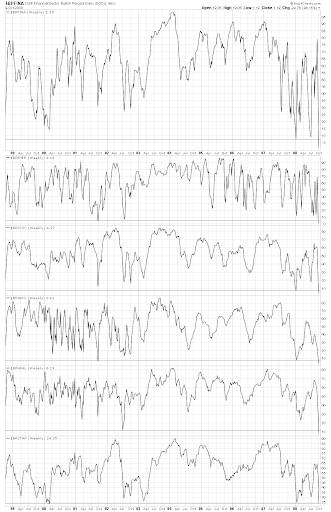
5.0.2 S&P Sector Bullish Percent Index. Maybe "overbought" doesn't mean anything at the time being. But let's take a look at major sectors anyway. Bullish Percent Index has reached a 10-year low now.
I quite enjoy your posts.....
ReplyDeletedave
Thanks. :-)
ReplyDelete