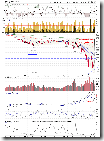
Today we have one more mid-term buy signal, which means the market gets improved at least over the intermediate term. In the short-term, the volume is a bit weak today, and the market may pull back tomorrow or on the next day according to 1.3.7 Russell 3000 Dominant Price-Volume Relationships. However I think the possibility of further rally in tomorrow morning is quite high, which is critical.
Take a look at those signals first.
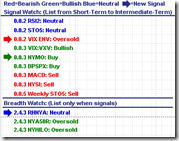
0.0.2 SPY Short-term Trading Signals. With respect to MA10 Envelop VIX is oversold (yes, it is oversold after only one day drop), and the oversold RHNYA has been corrected. In the short term, for a long time we haven't seen two up days in a row. Let's see how it goes tomorrow.
0.0.3 SPY Mid-term Trading Signals. NYMO at the bottom has given a buy signal, so now we have three mid-term buy signals on the chart. Take notice that the two most reliable mid-term signals, MACD and NYSI, are still sell signals although they are improved. If the NYMO buy signal doesn't go away, NYSI will give one soon.
0.0.0 Signal Watch and Daily Highlights. The overview of all signals is show as follows for your information.
2.0.2 Volatility Index (60 min). The pattern on VIX is likely a double top, and the negative divergence on MACD and RSI shows that VIX may drop down further, which is bullish to the market.
On 1.0.3 S&P 500 SPDRs (SPY 60 min) the symmetrical triangle composed by the dashed lines was broken today. However we can still draw an enlarged symmetrical triangle which is confirmed by three points of touch. Therefore, as real as it gets, it is critical whether SPX can break the upper edge of this triangle. I don't think the triangle has been broken out today because the part outside of the triangle is tiny and within the error range. Should the market sell off tomorrow, this symmetrical triangle will be valid and dominate, and 75% chance of the breakout will be at the downside. In addition, RSI at the top of the chart seems be testing the resistance, which supports the possibility that the triangle won't be broken.
Is it possible that the symmetrical triangle will be broken out? Maybe. Note the RSI on 1.0.4 S&P 500 SPDRs (SPY 15 min). RSI rarely reverses after a single overbought/oversold. Usually it has to enter into oversold/overbought twice and form a divergence before reversal. From this perspective, RSI just went overbought and may pull back tomorrow morning. Afterward it might likely rise again and form a double overbought.
1.3.7 Russell 3000 Dominant Price-Volume Relationships. The dominant price-volume relationships are 2100 stocks price up volume down, which is very bearish. According to the past statistics, the market may drop down tomorrow or as late as the next day. Therefore if RSI does go up for forming a double top, pay attention to the volume and be cautious to the day after tomorrow.
2.8.1 CBOE Options Total Put/Call Ratio. CPC is a bit over bullish today. If tomorrow it drops further, be cautious on the next day.
1.4.4 TSE McClellan Oscillator. A buy signal on the Canadian chart.


i love this blog. Thanks!
ReplyDeleteThanks!
ReplyDelete