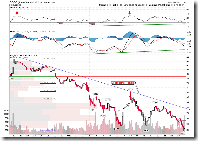
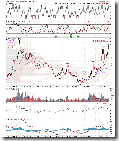
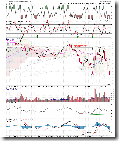
The rally at the end of trading hours shows that big money was defending the last Thursday low, nothing else. Tomorrow there is a way to see whether the market is willing to rise and how strong the strength is. As shown in the following chart, 3 steps are needed for mid-term trend reversal. First, we need an up day tomorrow, since SPX has never gone up for 2 days in a row since Oct, if tomorrow SPX rises, it will be a milestone. Second, it won't look good if the Monday high cannot be taken out should the market goes up tomorrow, because Tuesday and Wednesday the market was down, Thursday and Friday (suppose it will rise) the market was/will be up, if the rally cannot recover the loss in the previous two days, it means the upward strength is weaker than the downward strength. Third, the further confirmation is that Oct 14th high is taken out in order to form a real higher high, then the trend is confirmed to be reversed. After all, it seems quite tough to reach all three, and it's too early to relax and rise the up trend.
Short term signals:
1.0.4 S&P 500 SPDRs (SPY 15 min). Note the volume, the same scenario happened three times, which shows that big money was defending the last Thursday low. MACD and RSI at the top of the chart are positive divergence, so the possibility of further rally is pretty high.
1.0.3 S&P 500 SPDRs (SPY 60 min). The symmetrical triangle was broken today, but big money was defending and the support held. Now it looks like a descending triangle. In general, for a descending triangle the possibility of breakout at the downside is higher. Especially the market has tested the support three times, if the support is tested for the fourth time, very likely the descending triangle will not hold.
1.1.4 PowerShares QQQ Trust (QQQQ 60 min). QQQQ is very weak, and it formed a new low today. However MACD and RSI are positive divergence on 60-min chart, so it might due for a rebound.
1.3.7 Russell 3000 Dominant Price-Volume Relationships. Today the dominant price-volume relationships are 1448 stocks price down volume up, which shows that the market is oversold and likely bounce back up.
3.2.0 CurrencyShares Japanese Yen Trust (FXY Daily). Japanese Yen has reached a many-year high, but it is overbought. The doji today looks a bit toppy, and I believe it is due for a pullback, which is bullish to the stock market.
Mid-term signals:
1.2.6 INDU leads the Market. What the phenomena of INDU leading the market is that INDU is always ahead of other indices to be topped or bottomed. Usually INDU breaks out first, or forms a higher low while other indices are still lower low. This phenomena can be verified in the following chart, and it works well so far. Now look at the chart, while SPX and COMPQ have broken the last Thursday low and formed lower low, INDU is still a higher low, isn't it? This is a good news.
2.4.4 NYSE McClellan Oscillator. NYMO usually forms a positive divergence prior to the market bottom. Now we get a giant positive divergence. The red bars at the bottom of the chart do not have a new low which is lower than last Thursday while the market reached a lower low. This is also a good news.
Mid-term outlook is more and more encouraging. Of course it has to be confirmed by continuous strong rally.
Commodity:
3.1.0 US Dollar Index (Daily). US dollar formed a bearish reversal and should be due for a pullback, which is bullish for commodity.
3.3.0 streetTRACKS Gold Trust Shares (GLD Daily). The target of double top pattern on GLD has reached, and it is oversold. Should US dollar pulls back as expected, GLD will bounce back up too.
3.4.3 United States Oil Fund, LP (USO 60 min). MACD and RSI show positive divergence, and it may bounce back up.


I look forward to reading these every night. Thanks!
ReplyDeleteI have been a retail broker; a floortrader & member of an exchange. Your site is very thorough.
ReplyDeleteHowever, "INDU leads the Market" is counter to everyting that i have known about the mkt for 35 yrs. There's an old saying "The Generals don't lead the market."
Hi, Dave,
ReplyDeleteThanks. I agree with you about "Generals don't lead the market". Just I got the conclusion from the chart. It worked since last year. Don't know if it works now or not. And I certainly don't expect it works always and the chart is just one of a references for me. After all, the chart pattern is of the most importance, everything has to be confirmed by the chart pattern.
Thanks again.
There is one important indicator that could indicate precisely that either market is already at a bottom or top. As for the current market, it is only a short-term rally in the next couple of weeks/months. I would wait for the next drop to confirm trend reversal.
ReplyDelete