Has the market bottomed? 0.0.1 Market Top/Bottomed Watch, it seems so, at least very close. I say close because the rally near the end of trading hours was a bit over rush, and the typical reversal usually closes in green. So today may not mean anything, and we have to see if tomorrow the market will follow through.
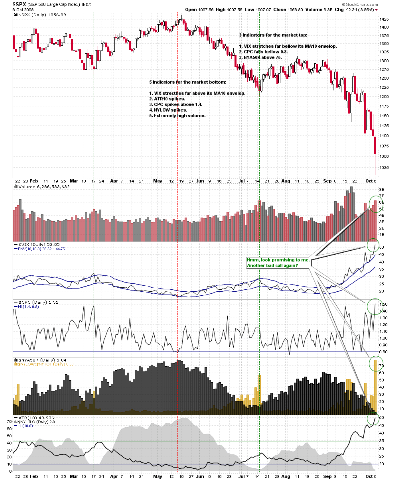
Will there be a follow through tomorrow? Maybe, the main reason is that the market is very very oversold. Note that my prediction about the next day market direction has been wrong for three days, which is rare in the past. Therefore I am not sure if the oversold market could be even more oversold tomorrow. 0.0.0 Signal Watch and Daily Highlights has all the signals, and all short-term signals as well as breadth are oversold except that there is no mid-term buy signal. You may refer to my chart book to see how over sold the market is at the time being.
1.3.7 Russell 3000 Dominant Price-Volume Relationships. This is the main reason why I think the market will go up tomorrow. During the past three days, the dominant price-volume relationships are price down volume up, and it seems highly capitulation. Therefore the probability of short-term rally is high.

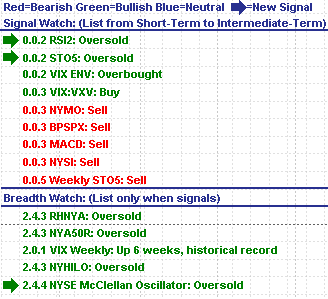
2.4.4 NYSE McClellan Oscillator, it is oversold. As far as I know, the market will have a good chance to bounce back up once NYMO is oversold. Also note that it is still positive divergence, which is very encouraging.

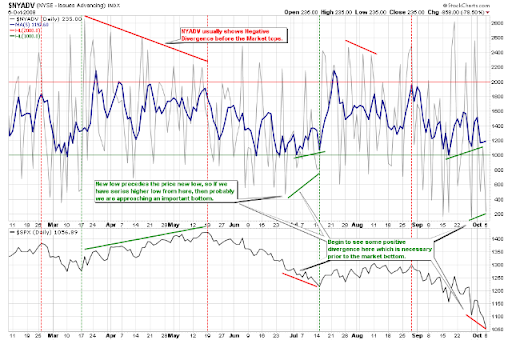
2.4.2 NYSE - Issues Advancing. This is very encouraging, too because it is higher low so far. However, it's better to not see it going down tomorrow, because a lower low means SPX will have a lower close than tomorrow's close. From the perspective of this indicator, the follow through tomorrow is very important, at least a heavy selling off is no good.
3.0.2 Credit Risk Watch. This chart is what I am worrying about. LIBOR spread is still very high, and the market cannot rally without solving this problem. So the government would better stand out. If you don't understand LIBOR, just look at the relationship between the black curve and the green curve which denotes the market, the higher is the black curve, more bearish is the market.
A simple explanation of LIBOR spread: in plain English LIBOR is the interest rate that banks borrow money from each other. UST3M is the yield of the treasury, which can be considered as an interest rate. Because of the credit of US government, the treasury is considered risk-free. The spread of LIBOR and UST3M is the difference between risky and risk-free loans. A big spread means the risk of inter-bank loan is high, and banks are reluctant to borrow money to each other, then there is no liquidity on the market. The data of LIBOR in StockCharts is 1-month, so I use UST1M instead of UST3M.

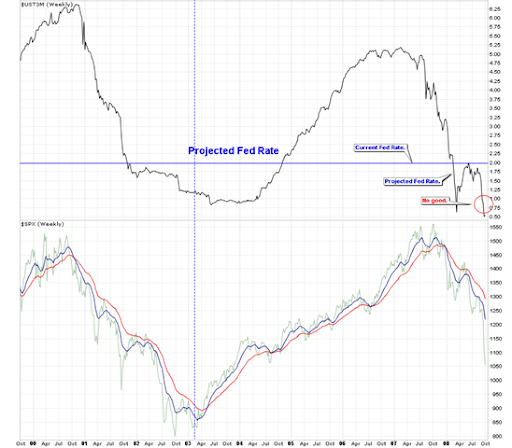
3.0.1 Yield Curve, UST3M. On the chart there is a big discrepancy between the projected Fed rate and current target rate, which means it is highly necessary to have an emergency rate cut.
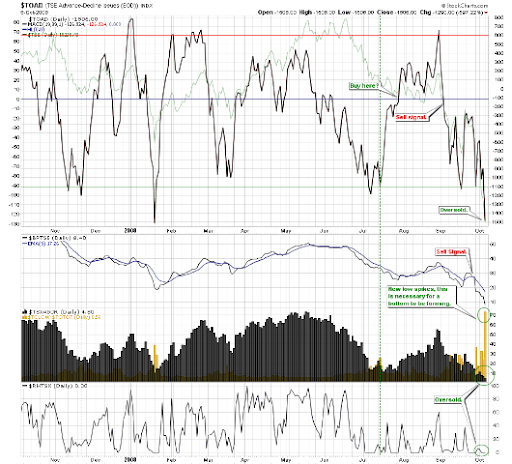
1.4.4 TSE McClellan Oscillator. Canadian market is extremely oversold as well. Today the market sold off for 1180 plus (equivalent to 1000 points for INDU).
Your idea of LIBOR and UST3M Spread (also known as TED Spread) is conceptually correct. However, you may not be aware that the $LIBOR in Stockcharts is NOT the LIBOR yield itself! It has the opposite correlation with the rate, just like the relationship between $UST and $TNX. So your $LIBOR:$UST1M ratio is misleading. Stockcharts has no chart to represent 3 months Treasury Bill. So I use BIL (an ETF) as a replacement. The ratio should be BIL:$LIBOR. Note that the ratio has been inversed in order to offset the bond price/yield relationship. Technically, it is not the real yield spread but it shows their general relationship.
ReplyDelete