Live Update

Friday, October 31, 2008

10/30/2008 Market Recap: Last chance for up 2 days in a row in Oct

No comments to the mid-term trend today since we have not seen any big pullback to challenge the previous conclusion.  Over the short term, tomorrow or the next week the market might pull back.  Therefore it is better not to chase should the market rally tomorrow.

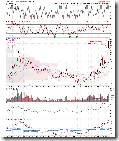
0.0.2 SPY Short-term Trading Signals.  The recent two candles are quite bearish, bearish shooting star and bearish hanging man, so pullback may happen tomorrow.  In addition, SPX has never gone up for 2 days in a row in October, and tomorrow is the last chance.  Let's see if the pattern of single day rally in October can be broken tomorrow.  Furthermore, today is an inside day, which means the second day might be a drop according to the statistics by a reader.  Although I do not think this evidence is strong enough, the chart does show it.

1

1.0.3 S&P 500 SPDRs (SPY 60 min).  Today RSI didn't break the resistance.

2

1.1.0 Nasdaq Composite (Daily), 1.3.0 Russell 2000 iShares (IWM Daily).  In the three days of rally, the volume is decreasing.  As mentioned earlier, this pattern has a high probability of pullback.

3

1.1.3 PowerShares QQQ Trust (QQQQ Daily).  STO hits the record resistance level on the chart.  So the probability of pullback is high.

4

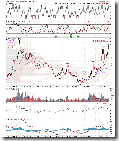
1.3.7 Russell 3000 Dominant Price-Volume Relationships.  Today 1789 stocks were price up volume down, which is the most bearish one among four price-volume relationships.  The statistics shows that, tomorrow or as late as the next Monday the market will pull back.

5

2.4.4 NYSE McClellan Oscillator.  NYMO is too close to overbought level, and this clearly tell us why it is not a good idea to chase the rally tomorrow.

6

2.8.1 CBOE Options Total Put/Call Ratio.  CPC has been lower than 0.8 for two days, which is too bullish to be good.

7

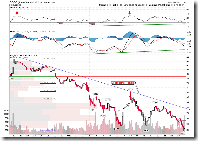
3.0.0 10Y T-Bill Yield.  Usually this chart says the market is at a top.  Just for your information, no further comments.  The past history of this indicator is shown on 8.0.4 Market top/bottom by ROC30 of 10Y T-Bill Yield 2005-2008 to 8.0.5 Market top/bottom by ROC30 of 10Y T-Bill Yield 2001-2004.  The conclusion is that the timing for market bottom is accurate, but timing for top can be one month earlier.

8

3.0.2 TED Spread. FYI only, I don't have a concrete conclusion.  It is good that LIBOR is falling, but 3 month T-bill Yield is also falling, I don't know whether this means the further rate cut or big moneys are short of fund.

9

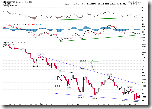
1.4.3 S&P/TSX Composite Index (15 min), MACD and RSI show negative divergence, so Canadian market will likely pull back.

10

Thursday, October 30, 2008

10/29/2008 Market Recap: 3 intermediate term buy signals

The bad news is that we still have not seen two up days in a row since October.  However the good news is we get several intermediate term buy signals.  As far as tomorrow is concerned, the daily chart is relatively bearish but there is no sufficient evidence to predict the market will definitely pull back tomorrow.

0.0.3 SPY Mid-term Trading Signals.  MACD, BPSPX, and NAMO are all buy signals, except for NYSI which is still not.

1

1.0.6 S&P 500 Bullish Percent Index.  The buy signal of BPSPX has been confirmed by all three major indices.  Previous two signals were proved to be whipsaw, hopefully the third time is not.

2

1.2.6 INDU leads the Market.  It does not really mean INDU leads the market.  What I mean is that, according to the chart in the recent one year, the progress of INDU is almost always ahead of other indices.  Tomorrow INDU showed a higher high ahead of others, which is a good sign, and the next step is to see if other indices follow.  By the way, while SPX and COMPQ were still lower lows, INDU clearly showed higher highs which is also a good sign.

3

With the aforementioned mid-term signals and two major accumulation days on 1.0.5 Major Accumulation/Distribution Days, the probability of mid-term rally should be relatively high.  Should the market pull back, we will get more evidence according to how far the pullback goes.

Tomorrow the market might pull back, but I am not very sure.

0.0.2 SPY Short-term Trading Signals.  Today the candlestick pattern is bearish shooting star, which has a high likelihood of trend reversal, so the market may pull back tomorrow.  Of course, this pattern requires a confirmation on the next day, the pullback cannot be proved by itself.

5

1.0.3 S&P 500 SPDRs (SPY 60 min).  This chart clearly shows that today's pullback happened while testing the gap resistance, and this is quite reasonable.  Note that the resistance on RSI seems effective.  If the market pulls back further tomorrow, a possible scenario is to kiss back the breakout point at the upper edge of descending triangle, which is seen very often after the breakout.

4

2.8.1 CBOE Options Total Put/Call Ratio.  Although it does not say the market will pull back for sure, CPC is over bullish today which is not good.

6

1.4.0 S&P/TSX Composite Index (Daily).  MACD gives a buy signal on the chart of Canadian market.

7

1.4.4 TSE McClellan Oscillator.  There are two buy signals on the chart.

8

1.4.3 S&P/TSX Composite Index (15 min).  However Canadian market may likely pull back tomorrow because of the negative divergence on MACD and RSI.

9

3.2.0 CurrencyShares Japanese Yen Trust (FXY Daily).  As pointed out by readers, because there are so many gaps on FXY chart, gap down cannot be considered as an island reversal.  This doesn't mean Yen won't pullback, it only says the terminology of island reversal isn't accurate.

10

Wednesday, October 29, 2008

Extremely low $TRIN readings

One of my friends pointed out today that $TRIN reading was ridiculously low. So what does this mean. Check the following chart. Compare the low with the green curve on the background which represents $SPX. Seems to me the extremely low readings of $TRIN always associate with the market bottom.

TRIN

10/28/2008 Market Recap: Follow-through Wanted

Today is a major accumulation day (1.0.5 Major Accumulation/Distribution Days).  As I mentioned in the past, I am not sure if Sep 30th can be considered as a major accumulation day, thus I tend to consider today is a follow-through Major Accumulation Aay since the Oct 13th Major Accumulation Day.  Therefore according the history record, the market could rise for 22% on average within 60 days from today's close.  For more information, one can refer to Sep 30th's market recap.  Once again, I have to emphasis that no signal is 100% accurate, on 0.0.0 Signal Watch and Daily Highlights all mid-term signals are still sell.  So you have to do your own due diligence to see if two major accumulation days are sufficient for mid-term buy.

1

Tomorrow is critical.  I have mentioned that the market has never up for two days in a row in October.  If tomorrow we could see a follow-through, it would be a milestone.  Of course, even the market rallies tomorrow we still need a higher high to confirm the trend reversal.  0.0.2 SPY Short-term Trading Signals, read the comments on the chart and you will know what I am talking about.

2

Will the market rally tomorrow?  On the chart it seems the market could pull back at least in the morning.  Whether or not the market could close in green, we have to see how the market reacts to the rate cut by the Fed.  Very likely at 2:15pm when Fed declares the rate cut, the market may swing violently.

1.0.4 S&P 500 SPDRs (SPY 15 min).  This is why the market is due for a pullback in the morning, because the RSI is deeply overbought.

3

1.0.3 S&P 500 SPDRs (SPY 60 min).  Note the RSI is on resistance.  There are plenty of information on the chart, the bad news is heavy resistance is at above, just look at three gap resistance.  The good news is descending triangle seems having broken out on the upside.  Furthermore, MACD and RSI show obvious positive divergence which usually means that SPY should have a decent upside room.

4

3.2.0 CurrencyShares Japanese Yen Trust (FXY Daily).  Island reversal is formed on the chart of Japanese Yen today, which is a good news to the stock market.

5

3.2.4 Yen RSI and the Market Top/Bottom.  Once again I would like to show that it is effective to judge the market top/bottom based on oversold RSI of Yen.  By the way, recently many signals stop working except for three signals, and this chart is one of them.  2.4.2 NYSE - Issues Advancing which uses 5-day moving average to judge the oversold is another one (fore more details please read yesterday's market recap).  The last one is 1.0.5 Major Accumulation/Distribution Days which says the market should rally significantly after two to three major distribution days, so far it works.

6

1.4.2 S&P/TSX Composite Index (60 min).  The chart of Canadian market looks like a bullish falling wedge, and MACD and RSI show positive divergence, so it may bounce back up.

7

3.3.0 streetTRACKS Gold Trust Shares (GLD Daily).  The gold is an ascending triangle, and the upside breakout is more likely.

8

3.4.3 United States Oil Fund, LP (USO 60 min).  MACD and RSI show positive divergence.

9

Tuesday, October 28, 2008

10/27/2008 Market Recap: No Title

No so much to talk about today.  Nothing new but oversold and the market might be due for a rebound should it be rational.  I have to admit that those signals that I collected over the time had been very accurate in the past but they don't work very well recently.  The problem is caused by the massive selling off from big moneys which are obviously in trouble, nothing can be improved before those big moneys stop selling.  The criteria to judge the trend reversal is still the same, whenever the market rises for two days in a row, we start to hope.

What about tomorrow? The market might bounce back.

0.0.2 SPY Short-term Trading Signals.  Recent pattern is one up day followed by two down days.  Now we have two down days, so tomorrow might be an up day.  Furthermore, recent two candles look a bit like bullish inverted hammer, and they stand above Oct 10th low, which means a reversal is possible.

1

2.4.2 NYSE - Issues Advancing.  Note the bold blue curve has entered into the oversold region.  In the past NYADV had been quite accurate, the market always bounced back.  Recently the timing is a bit off, however note that the rally on Oct 13th happened while this indicator was oversold.  This means the overbought of this indicator is more effective than those ones in 2.4.3 Breadth Oversold/Overbought Watch.

2

3.2.0 CurrencyShares Japanese Yen Trust (FXY Daily).  Japanese Yen is overbought, in the recent two days black candles, which often causes reversal, compose a bearish harami.  Therefore it might pullback, which is good for rally of the stock market.

3

1.0.3 S&P 500 SPDRs (SPY 60 min).  It is still a descending triangle, and today SPY has touched the support fore three times which is considered as a confirmation.  If tomorrow SPY rises and sells off eventually, then test the support for the fourth time, the support will likely break.  Of course, the breakout of descending triangle is bidirectional, we cannot rule out the possibility of breakout at the up side.

4

Sunday, October 26, 2008

10/24/2008 Market Recap: Descending Triangle

Usually a bottom is not in place before VIX forms a reversal candle (e.g., black candle, Doji, etc), from this perspective the Friday low may not be a bottom.  What about next Monday?  There is a pattern recently, once it repeats the market should rise.  Will be the third time different?  I don't know.

0.0.2 SPY Short-term Trading Signals.  Friday hollow red candle appears, then the next Monday opens high closes higher.  In the past the third time is often different.  So it is unknown how it goes this time.

1

1.0.3 S&P 500 SPDRs (SPY 60 min), the odd isn't at bulls' side, major indices all look like descending triangle (QQQQ has broken out), and the theoretical target is scary.  However I am inclined to (or wish) believe the theoretical target is 2002 low.  1.0.2 S&P 500 Large Cap Index (Monthly), on the monthly chart, it would just take 1-2 days anyway given such a dramatic speed of falling down.

2

 3

3.2.4 Yen RSI and the Market Top/Bottom.  Every time the RSI of YEN reaches overbought region, the market is close to a bottom or has a big rally.  Now it is overbought again, and this is obviously a good news.

4

3.4.2 United States Oil Fund, LP (USO Weekly).  The crude oil seems being testing the long term support. Period.

5

3.4.3 United States Oil Fund, LP (USO 60 min).  Oil dropped down on last Friday but MACD and RSI still show positive divergence.

6

Friday, October 24, 2008

10/23/2008 Market Recap: 3 steps to confirm trend reversal

The rally at the end of trading hours shows that big money was defending the last Thursday low, nothing else.  Tomorrow there is a way to see whether the market is willing to rise and how strong the strength is.  As shown in the following chart, 3 steps are needed for mid-term trend reversal.  First, we need an up day tomorrow, since SPX has never gone up for 2 days in a row since Oct, if tomorrow SPX rises, it will be a milestone.  Second, it won't look good if the Monday high cannot be taken out should the market goes up tomorrow, because Tuesday and Wednesday the market was down, Thursday and Friday (suppose it will rise) the market was/will be up, if the rally cannot recover the loss in the previous two days, it means the upward strength is weaker than the downward strength.  Third, the further confirmation is that  Oct 14th high is taken out in order to form a real higher high, then the trend is confirmed to be reversed.  After all, it seems quite tough to reach all three, and it's too early to relax and rise the up trend.

1

Short term signals:

1.0.4 S&P 500 SPDRs (SPY 15 min).  Note the volume, the same scenario happened three times, which shows that big money was defending the last Thursday low.  MACD and RSI at the top of the chart are positive divergence, so the possibility of further rally is pretty high.

2

1.0.3 S&P 500 SPDRs (SPY 60 min).  The symmetrical triangle was broken today, but big money was defending and the support held.  Now it looks like a descending triangle.  In general, for a descending triangle the possibility of breakout at the downside is higher.  Especially the market has tested the support three times, if the support is tested for the fourth time, very likely the descending triangle will not hold.

3

1.1.4 PowerShares QQQ Trust (QQQQ 60 min).  QQQQ is very weak, and it formed a new low today.  However MACD and RSI are positive divergence on 60-min chart, so it might due for a rebound.

4

1.3.7 Russell 3000 Dominant Price-Volume Relationships.  Today the dominant price-volume relationships are 1448 stocks price down volume up, which shows that the market is oversold and likely bounce back up.

5

3.2.0 CurrencyShares Japanese Yen Trust (FXY Daily).  Japanese Yen has reached a many-year high, but it is overbought.  The doji today looks a bit toppy, and I believe it is due for a pullback, which is bullish to the stock market.

6

Mid-term signals:

1.2.6 INDU leads the Market.  What the phenomena of INDU leading the market is that INDU is always ahead of other indices to be topped or bottomed.  Usually INDU breaks out first, or forms a higher low while other indices are still lower low.  This phenomena can be verified in the following chart, and it works well so far.  Now look at the chart, while SPX and COMPQ have broken the last Thursday low and formed lower low, INDU is still a higher low, isn't it?  This is a good news.

7

2.4.4 NYSE McClellan Oscillator.  NYMO usually forms a positive divergence prior to the market bottom.  Now we get a giant positive divergence.  The red bars at the bottom of the chart do not have a new low which is lower than last Thursday while the market reached a lower low.  This is also a good news.

8

Mid-term outlook is more and more encouraging.  Of course it has to be confirmed by continuous strong rally.

Commodity:

3.1.0 US Dollar Index (Daily).  US dollar formed a bearish reversal and should be due for a pullback, which is bullish for commodity.

9

3.3.0 streetTRACKS Gold Trust Shares (GLD Daily).  The target of double top pattern on GLD has reached, and it is oversold.  Should US dollar pulls back as expected, GLD will bounce back up too.

10

3.4.3 United States Oil Fund, LP (USO 60 min).  MACD and RSI show positive divergence, and it may bounce back up.

11

Disclaimer

The information contained on this website and from any communication related to the author’s blog and chartbook is for information purposes only. The chart analysis and the market recap do not hold out as providing any financial, legal, investment, or other advice. In addition, no suggestion or advice is offered regarding the nature, profitability, suitability, sustainability of any particular trading practice or investment strategy. The materials on this website do not constitute offer or advice and you should not rely on the information here to make or refrain from making any decision or take or refrain from taking any action. It is up to the visitors to make their own decisions, or to consult with a registered professional financial advisor.

This websites provides third-party websites for your convenience but the author does not endorse, approve, or certify the information on other websites, nor does the author take responsibility for a part or all materials on the third-party websites which are not maintained by the author.