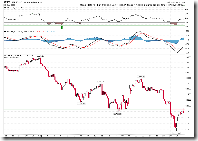
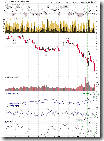
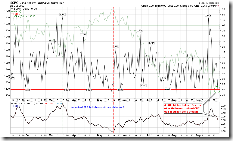
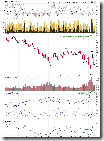
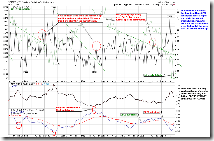
1.0.5 Major Accumulation/Distribution Days. Surprisingly today is a Major Accumulation Day. Concerning major accumulation day, a single day does not have significant meaning, what is important is the second one, so called Follow-through Major Accumulation Day. Today is the first one. Sep 18th is almost a major accumulation day, so today might be considered as the second one.
The theory of the major accumulation day is:
- Double major accumulation days predict a strong rally over the intermediate term. The historical data is in chart 8.2.0 Major Accumulation Day 2007-2008 to chart 8.2.5 Major Accumulation Day 1997-1998, so far it is 100% correct. A professor has studied this and here is the abstract:
"David Aronson, a professor of finance at Baruch College looked at instances in the market (from 1942 to present) when we have these double 90-90 days. His time frame for the second is much wider than what we just witnessed - 3 months. But the results are intriguing nonetheless. - The reason why Sep 18th may be the first major accumulation day can be referred to 8.2.4 Major Accumulation Day 1999-2000 and 8.2.5 Major Accumulation Day 1997-1998, where one of two major accumulation days does not meet the criteria strictly. Therefore, very likely today is a follow-through major accumulation day. On the other hand, I am not very sure about this, especially before the bailout plan is confirmed to be approved, I don't think the market would have a significant rally.
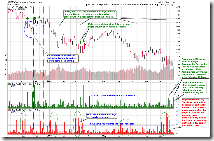
- If today is the first major accumulation, be cautious to do the bottom fishing. On the following chart, the blue comment shows the reason, i.e., it's possible to see a massive selling off, and yesterday may not be the bottom.
After the special circumstance of a double 90-90 day, the following 60 (trading) days have historically provided a return of +22% instead of a paltry 4.5% annualized otherwise. It is more remarkable when you consider that that return comes with the assumption that you enter the market on the close, after a double 9-to-1 signal was triggered and without adding any dividends!"
OK. What about the near term, for instance, tomorrow? Well, probably a pullback is due.
1.1.5 PowerShares QQQ Trust (QQQQ 15 min), 1.0.4 S&P 500 SPDRs (SPY 15 min). The pattern looks like a bearish rising wedge, and the Fib 50 is tested back. Therefore, be cautious.
1.3.7 Russell 3000 Dominant Price-Volume Relationships. This is the primary concern today, up on decreased volume, 1391 stocks price up volume down, which is the most bearish one among four price-volume relationships. According to my statistics, very likely the market will pull back tomorrow or the next day.
3.1.0 US Dollar Index (Daily), US dollar is overbought and it has rallied for seven days. So far the historical record is seven days of rally in July. Therefore US dollar may pullback, which is bearish to the stock market.
1.1.7 TRINQ Trading Setup, TRINQ is below 0.6 today. According to this setup QQQQ will drop down tomorrow. The success rate is now 79%.
Of course I don't think this potential pullback can go very far (I said the same in the last week report, and INDU plunged for 777 points yesterday. Hopefully it doesn't happen again). The reason is that both NYA50R and RHNYA are still oversold on the chart 2.4.3 Breadth Oversold/Overbought Watch.
1.4.2 S&P/TSX Composite Index (60 min). TSX is right at the resistance on Canadian market. Tomorrow it might pull back as well.


