Firstly I would like to give my two cents concerning LEH:
Concerning that the market opened at low and closed at high on Thursday and Friday, I suspect this is a speculative play to bet the US government would bail out LEH.
- If the US government decided to bail out LEH on Monday, it would imply that the government might potentially bail out all companies in trouble. This would surely be a good news, even better than bailout of FRE/FNM, and the market might rally in the short term. However the long term influence is unimaginable, so the bailout may not happen.
- If the bailout does not happen but some banks inject money to LEH, you may refer to what happened at the time when FRE/FNM was bailed out. I don't think this is a better stimulus than that, actually the consequence might be bearish.
- If the speculative play on Thursday and Friday turns out to be real, will the market open at high and let speculative players run away?
- I keep saying that Wall Street's game is different at the third time. On Thursday and Friday, the market opened at low and closed at high. If the market opens at low again on Monday, will it rise and close at high one more time?
In my opinion, LEH event may be a key turning point of the market movement, either upward or downward. It seems like a irresolvable puzzle unless the government stands out.
Recently the market is very volatile and confusing. My suggestion is to forget the near-term oscillation and check out the bigger picture. Thus I will review the common used market bottom indicators and see if we have seen or are approaching a bottom.
Here is my conclusion:
- Very likely the mid-term bottom is not there yet.
- Over the short term the market is due for a pullback.
The evidences for short-term pullback:
1.3.7 Russell 3000 Dominant Price-Volume Relationships. On Friday 1030 stocks were price up volume down, thus we have seen three days of bearish price-volume relationship. Therefore the probability of short-term pullback is very high.
1.0.4 S&P 500 SPDRs (SPY 15 min), bearish rising wedge. Negative divergence on MACD and RSI. So it is due for a pullback.
1.0.3 S&P 500 SPDRs (SPY 60 min), 1.1.8 PowerShares QQQ Trust (QQQQ 60 min), 1.2.3 Diamonds (DIA 60 min). The resistance on RSI is quite strong since it held well on Friday.
3.1.1 US Dollar Index (Weekly), US dollar hit the resistance and formed a bearish shooting star. It looks like being due for a pullback.
3.2.3 US Dollar/Japanese Yen Ratio. From the negative divergence on MACD and RSI as well as the bearish shooting star on 3.1.1, the pullback of US dollar is bearish to the stock market.
Now let's review the market bottom indicators.
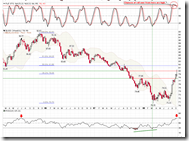
0.0.2 Market Top/Bottomed Watch is the most important chart for pinpointing the market bottom. Take a look at those comments in red boxes, how does the bottom look like previously? How does the pattern look like currently? The market is not likely at the bottom, right? Just to remind you that this is a matter of probability, maybe this time is different. However, technical analysis does not consider this kind of low probability event or "this time is different".
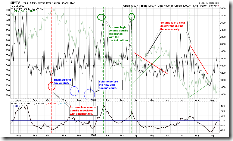
2.0.0 Volatility Index - NYSE (Daily). VIX is not high enough. Some people have been saying over and over again that maybe VIX will not spike up this time. Every time they were disappointed by the new spike of VIX. Hmmh... maybe VIX will not spike this time?
2.3.3 NYSE Total Volume. In the last week the volume of major indices spiked up and gave people an illusion that the market has bottomed out. However NYSE Total Volume is the one which reveals out the volume genuinely. It isn't high enough, is it? Especially the normalized volume at the bottom of the chart, note how previous bottoms look like marked by the green dashed lines. The bottom is not reached before the black curve crosses above the blue line. Maybe this time is different? YMYD.
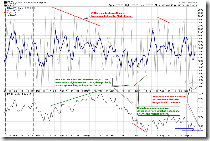
2.4.2 NYSE - Issues Advancing. This chart predicts that there will be a new low close ahead for SPX which is lower than 1224. Usually the market bottoms out after a positive divergence is formed on the chart. So far the pattern is still lower low, which means there will a series of closes lower than 1224, and only when NYADV forms highs lows continuously at the same time SPX can reach a bottom. If you get confused, you may refer to the positive divergence before the July bottom.
As a summary, I don't think the market has bottomed out.
A few interesting charts:
1.4.0 S&P/TSX Composite Index (Daily). The Canadian market has rallied for three days while the volume decreased continuously. This pattern has been mentioned many times -- it is due for a pullback.
1.4.3 S&P/TSX Composite Index (15 min), Bearish Rising Wedge predicts a pullback is due.
3.0.1 Yield Curve. UST3M is lower than Fed Rate by 0.5 point, which means the market is in trouble and it's possible that the Fed might cut the rate. You may have heard this through the media.
3.3.0 streetTRACKS Gold Trust Shares (GLD Daily). Since the US dollar is due for a pullback, the gold price may rise. Bullish morning star, positive divergence on MACD and RSI, STO is on the support, all these look good.
3.4.3 United States Oil Fund, LP (USO 60 min). Positive divergence on MACD and RSI.


Cobra!
ReplyDeleteU have the wrong link on your
3.0.1 Yield Curve.
Great site...
keep it up!!
If LEH blows up tonight.. WATCH OUT!!! KABOOMMMMMM!!
Thanks! Corrected.
ReplyDelete