As you can see the market is somewhat emotional and driven by news. From the perspective of the Technical Analysis, two buy signals in 0.0.3 SPY Mid-term Trading Signals are still valid, so I assume the trend is up over the intermediate term. In the near term, the market may likely rally tomorrow.
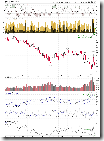
0.0.2 SPY Short-term Trading Signals. Here is the evidence for tomorrow's rally. NYAD indicates that there are more Advancing issues today compare with yesterday, which is a positive divergence. RHNYA at the bottom of the chart is oversold, which also support the rebound of the market. In addition, VIX is overbought which is also bullish to the market.
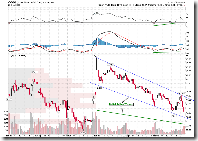
1.1.5 PowerShares QQQ Trust (QQQQ 15 min), Bullish Falling Wedge, MACD, RSI positive divergence.
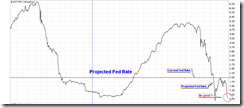
3.0.1 Yield Curve. Today UST3M went down again, which means the short of fund. This is bearish.
Disclaimer
The information contained on this website and from any communication related to the author’s blog and chartbook is for information purposes only. The chart analysis and the market recap do not hold out as providing any financial, legal, investment, or other advice. In addition, no suggestion or advice is offered regarding the nature, profitability, suitability, sustainability of any particular trading practice or investment strategy. The materials on this website do not constitute offer or advice and you should not rely on the information here to make or refrain from making any decision or take or refrain from taking any action. It is up to the visitors to make their own decisions, or to consult with a registered professional financial advisor.
This websites provides third-party websites for your convenience but the author does not endorse, approve, or certify the information on other websites, nor does the author take responsibility for a part or all materials on the third-party websites which are not maintained by the author.


I tend to agree I think we could be overdo for a pop up ..... volume dropping off without any big news to the downside everybody has factored in that some type of bailout plan will come into play. With the reduced volume I tend to agree in the rise as most sellers could have climaxed out at least in the next week or so before the next sell off.
ReplyDeleteLet's wait and see. If I were wrong again tomorrow, then I would be wrong for 2 days in a row which is rare for me recently. Maybe my luck is gone. :-)
ReplyDeletehi cobra,
ReplyDeleteThanks for such nice analysis. Help us alot.
You mention about intermediate term buy signal. However, I believe there are also some charts which are still bearish (ie. charts that say Bottom not in yet). Wonder why the bullish bias is preferred?
For example, T2101 brown curve needs to go down for some time before bottom - is it down yet?
ReplyDeleteSPY drop 3 days in a row - not happening yet?
McClellan Oscillator (2.2.1) - No positive divergence yet?
NYSE advancing issue (2.4.2) - normally a series of lows, now only 1st low?
Nasdaq Total Volume/NYSE Total Volume (2.3.4) - now above "high" level again?
With above, wonder if it is possible short or medium term bullish?
Thanks!
Yes, not all conditions were met, so probably you're right. Let's see.
ReplyDeleteBut for me, as long as there're 2 mid-term buy signals, I'll treat it as mid-term up. Also, chart 0.0.1, all bottom conditions were met, so most likely we were bottomed. And generally, I cannot require that absolutely every conditions are met. And there're no 100% correct indicators. So have to take some risks.
Yes. Its true. (News from Bloomberg)
ReplyDeleteThe real question is, who is copying who?
Kazakhstan Plans Paulson Style Bailout: Borat?