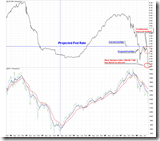
At the beginning of the report, I would like to have your attention on the following chart. I believe we are witnessing the history, and the market is in a panic mode. The interest rate of 90-day short-term bond is nearly zero! As far as the historical record on the chart, this never happened before. I think this may be connected with a series of events that happened recently, and it seems the market is having a big trouble because the chart predicts an immediate necessity of rate cut by the Federal Reserve.
Today's conclusion:
- Today's low might not be the bottom;
- The market may bounce back tomorrow. If it doesn't, very likely the bottom will be formed in a few days.
0.0.0 Signal Watch and Daily Highlights. Besides 2.7.0 NYSE % of Stocks Above 50 Day MA (Daily), all my indicators have signaled a market bottom or predicted a rebound. But are we there yet? As I said previously, currently my daily report has to involve a factor of guess. Therefore, my dear readers, pretty much you are on your own now. I am afraid that the past success rate is unsustainable at the time being, especially the analysis of the short-term direction.
Other than the indicators, my criterion for pinpointing a bottom are:
- Very often the market will keep dropping for three days. In addition it should not open low close high everyday, because in this way no one will cut loss but fish the bottom -- "Wow! It opens low again, let's rush in and get the money!". On the contrary, any rebound on any trading day should fail consistently, while people get an impression that every rebound is a chance to cut loss, every time after the rebound people should feel regret -- why didn't I run away at the last rebound? Now the market is like a hell... well, thank God, here is one more rebound, let's run quickly right now! This is why I doubt the market was not at the bottom yesterday.
- Usually the day of the market bottom is the reversal during the trading hours, and close in green. In the morning the market will open low and keep dropping down, and it looks like the magnificent selling-off will repeat once again. Around the noon the market may start to bounce back, while the rally should be definitely not like the suddenly appeared big candles that happened today. On the other hand, the market should behave like a orderly propagating wave -- advance two steps and decline one step, so on and so forth. The idea is that a quick rally cannot accumulate sufficient shares at a low price, so a quick rally is more likely for distribution while a waving rally is for accumulation.
As a summary, I tend to believe that the market is not bottomed yet. Anyway we have a pattern to follow, so you may keep it in mind before catching a bottom.
Don Worden gave a projection of SPX target in today's report. I found a good match on the SPX monthly chart and this makes me a little nervous.
What was missing? The market hadn't gone down enough after slicing through those July closing lows that I had been harping on for several days last week. After the key level had been shattered, the market needed an appropriate run on the downside--sometimes referred to as a measured move. Roughly speaking, the market could be expected to drop a distance roughly equaling that from the May high to the July low. For the SP-500 that was about 1425 to 1200. Starting at the August high, a measured move would extend from the August high (1300) to approximately 1075. (Mathematical precision not expected). Such a move would offer a logical objective. And it still stands.
1.0.0 S&P 500 Large Cap Index (Daily), Measured Move,target, 1073.
1.0.2 S&P 500 Large Cap Index (Monthly). The Fib 61.8 on the monthly chart is about 1073. Is this good match by chance? I don't think so.
Where will the market go tomorrow? Two reliable indicators are oversold today. If the market is not panic, there is a great chance the market may bounce back.
2.2.1 NYSE McClellan Oscillator, oversold.
2.4.2 NYSE - Issues Advancing. The blue line have touched the green horizontal line, so it is oversold. In the past the market will bounce back if NYADV is oversold, no exception so far. Additionally, there is a bit positive divergence on the chart, which is the first step of forming a bottom. Of course SPX may have a new low, however it should be fine as long as NYADV does not form a lower low.
2.0.0 Volatility Index - NYSE (Daily). STO has reached a level where it often reversed in the past. Therefore VIX may pull back which is bullish to the stock market. By the way, the market seldom bottoms out while VIX closes at such a big white candle as today. Therefore this chart also says that today's low is not the bottom from another perspective.
1.0.4 S&P 500 SPDRs (SPY 15 min), 1.2.7 Diamonds (DIA 15 min), 1.3.6 Russell 2000 iShares (IWM 15 min), positive divergence on MACD and RSI, bullish.
1.4.4 TSE McClellan Oscillator. Canadian market is oversold. 1.4.3 S&P/TSX Composite Index (15 min), positive divergence on MACD and RSI on the 15-min chart.


7 indicators screaming panic selling. wow.
ReplyDelete