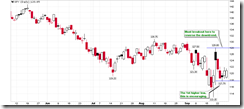
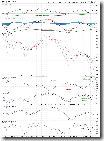
0.0.2 SPY Short-term Trading Signals. With so many bad news on Friday, it would not be a surprise to me if INDU dropped down 500 points. Surprisingly SPX held the Wednesday low, which is quite encouraging. I do not know whether or not the bailout deal can be reached by Monday, but it seems the market is ready to rally according to the chart. In the short term, because the breadth is still oversold, I doubt how big the downside space is even if there was no deal.
2.4.3 Breadth Oversold/Overbought Watch. The three important indicators for watching breadth oversold/overbought are put on the same chart as follows. It can be seen that RHNYA is deeply oversold, and the other two are also very close to the oversold region and show positive divergence as well. This is the primary evidence that I don't think the market has a big downside space.
2.0.1 Volatility Index (Weekly). VIX has rallied for five weeks for the first time in the history. In the next week it is very likely that VIX will drop down, which will be bullish for the stock market.
0.0.3 SPY Mid-term Trading Signals. Note that the positive divergence of MACD and RSI is very similar with the setup in March. Considered the current level of VIX:VXV, the market will very possibly have a terrific rally over the intermediate term just like the one from March to May.
As a summary, the intermediate term trend is bullish.
1.4.4 TSE McClellan Oscillator. On the Canadian market, both RHTSX and TSXA50R are oversold, and I think the market might bounce back.
1.4.3 S&P/TSX Composite Index (15 min). The pattern looks like an Ascending Triangle, and the probability of upside breakout is relatively high.
3.1.0 US Dollar Index (Daily). US dollar may form a bear flag and thus may resume dropping soon. The correction of US dollar is a good news for commodities, and also favors a bullish Canadian market. By the way, 3.2.1 Japanese Yen (Weekly), Bearish Harami, and I think Japanese Yen will possibly pull back, and this may offset the pullback of US dollar as well as its negative influence to the stock market.
3.3.2 streetTRACKS Gold Trust Shares (GLD 60 min), Ascending Triangle. If US dollar goes down, GLD may rally again.
3.4.3 United States Oil Fund, LP (USO 60 min), Symmetrical Triangle. The rising of oil may be continued.
As a summary, Canadian market will probably turn bullish, so will the commodities.


Nice charts I'm eyeing the positive divergences also and how high VIX is.
ReplyDeleteIm thinking the market hasnt tanked upon all this bad news so it is def looking for something to move up.