Live Update

Sunday, August 31, 2008

08/29/2008 Market Recap: Weekly STO indicator sees a top coming

Take a look at this chart: 0.0.5 Weekly STO and the Market Top/Bottom.  Think about how the market (denoted by the green line) goes every time when STO gives a sell signal (black line cross downward red line).

1

This chart says:

  1. Most likely the market is in the top area instead of bottom area.
  2. Violent oscillation is one of the market top characteristics, which is also exactly what we saw recently.  As indicated as green circles, we cannot rule out the possibility of seeing one or two weeks of sideway or even higher high.

Some people may have many bull market patterns that the market keeps going up for two months after the weekly STO sell signal.  Is it possible that the market is at the beginning or middle of two up months?

2.0.1 Volatility Index - NYSE (Weekly).  Note that STO is at a multiple-year low.  The probability of dropping even lower isn't zero but should be quite low.

2

2.0.0 Volatility Index - NYSE (Daily).  Weekly chart shows the high possibility of rising VIX, so the pattern in the following chart is very likely a Bullish Falling Wedge.

3

2.0.2 Volatility Index 30-day/90-day Ratio.  Don't forget where we are on this chart.  I don't think the market has a big upside room.

4

3.1.1 US Dollar Index (Weekly).  STO is at a multiple-year new high.  US dollar may consolidate at the current level or moderately pull back.

5

3.1.0 US Dollar Index (Daily).  If you trust in the weekly char, you may agree that the Bearish Rising Wedge on the following chart isn't a wishful thinking.  Take further notice at the negative divergence of all indicators.

6

2.8.1 CBOE Options Total Put/Call Ratio.  Note the yellow region, normalized CPC is still a bit low which is not good.

7

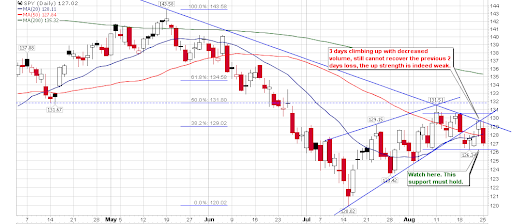
2.3.3 NYSE Total Volume.  This is too low.  The rally since July 15th is always on a decreasing volume, and I think it is bearish.

8

Many bulls are arguing that this year is an election year, and republicans won't let the stock market crash.  This sounds like the rumored Olympic rally in Chinese market in the past.  Concerning this argument, here is a paragraph of August 29th Market Message by John Murphy,

... ... September has been the weakest month of the year since 1950 with an average S&P 500 loss of -0.6. October is also a tricky month. It often starts off weak and ends strong. October has included some of the market's worst declines. The good news, however, is that October has often marked major bottoms... ...

... ... presidential election years are usually up years. Most of those gains come in the second half of the year. The last seven months have seen gains in 13 of the last 14 election years (the only exception being in 2000 when the election results were delayed). That would seem to bode well for this year ending strong. A study of presidential year patterns seems to show two distinct patterns. Several bottoms took place by mid-year (1996, 1988, 1984). Others took place during October (2004 and 1992). That doesn't help us determine whether this year's bottom is behind us or ahead of us. It does mean, however, that odds favor the market ending the year on a stronger note once it gets beyond the dangerous September/October period.

In summary, the market may very close to a mid-term top.  A better scenario could be a one to two weeks of sideway and even a higher high.  But don't hope too much, we cannot rule out the possibility that we have missed the top.  Of course this is just my guess.  Always remember that there is no mid-term sell signal on 0.0.0 Signal Watch and Daily Highlights.  In term of operation, I will do short-term counter-trend short at high, but still hold mid-term long positions which has been reduced.

What will happen next week?  The market won't move on Monday, for sure.  What about Tuesday?  It's not very clear given some evidence from both bullish and bearish sides.  I guess, SPX will drop a bit due to pullback of financials.

Bearish reasons:

5.3.0 Financials Select Sector SPDR (XLF Daily).  This is the main reason I guess SPX will drop a bit.  XLF has rallied for four days.  Besides the mad rally after July 15th, this never happened before.

9

Take a look at the XLF 15-min chart, bearish rising wedge, MACD and RSI negative divergence.  So it should pullback unless there is a really good breaking news on Tuesday causes XLF rally by 3%.

10

1.0.4 S&P 500 SPDRs (SPY 15 min).  This is a typical bearish 1-2-3 format, lower low, and it means that the pullback will continue on Tuesday.

11

Bullish reasons:

1.1.6 PowerShares QQQ Trust (QQQQ Daily).  QQQQ was weak on Friday.  But on the daily chart it has pulled back on to a support.  The yellow region is a consolidation area and the support should be quite strong.  I am not convinced that QQQQ could dive down cross such a strong support region at the first try.

12

1.1.8 PowerShares QQQ Trust (QQQQ 60 min).  Because of bullish falling wedge pattern, the 60-min chart also supports the short-term rebound argument.  Of course it doesn't mean QQQQ will bounce back immediately on Tuesday.

13

1.3.6 Russell 2000 iShares (IWM 15 min).  The pattern on IWM looks like a symmetrical triangle.  It might go up.

3.2.0 Japanese Yen (Daily).  It is testing the important resistance again.  The black candle is rather bearish but this is bullish to the stock market.  Note that the Japanese Yen is probably forming an Ascending Triangle, and finally break out the resistance and go up.  This is consistent with judgement that the US dollar may consolidate or pull back.

14

Concerning this chart, whether the TA is accurate or my feeling is more reliable: 5.2.3 Energy Select Sector SPDR (XLE 60 min).  It surprised me that MACD and RSI negative divergence, and XLE will drop further.

If XLE drops, Canadian market will likely pull back.

1.4.4 TSE McClellan Oscillator.  This is the main reason I think the Canadian market will pull back.  The black line is too high.

15

1.4.0 S&P/TSX Composite Index (Daily), overbought, bearish rising wedge.

16

1.4.3 S&P/TSX Composite Index (15 min).  MACD and RSI show negative divergence.  By the way, this negative is quite impressive.

Friday, August 29, 2008

08/28/2008 Market Recap: Very Close to Overbought

0.0.1 Simple SPY Trading System has no material change today.  The mid-term direction is still undetermined because of no higher high, so we have to wait and see tomorrow's market.  Now bulls are facing an improved situation as the frontline has been pushed to the upper range, and it will be bears' turn to defend itself.

1

0.0.0 Signal Watch and Daily Highlights.  Take a look at the summary of all signals.  Mid-term signals are all green, but there are several new orange warning signals which mean near-term overbought, that's it.  You may like to pay more attention to this chart, which clearly and briefly show the mid-term and short-term situations.  For new traders, you just follow the mid-term signal and disregard the up and down everyday.  For fast hands, you may do counter-trend trades according to occasional warning signals, which of course is riskier.

2

In the short-term, we have a few reliable breadth indicators are overbought or close to overbought.  So if the market rises tomorrow, I believe the short trades will have a high probability of success -- unless we are in a Final Climax Run which has been talked for a long time.

2.2.1 NYSE McClellan Oscillator.  It is a bit too high.

3

2.4.2 NYSE - Issues Advancing.  It is a bit too high as well.

4

2.8.1 CBOE Options Total Put/Call Ratio.  This is over bullish.

5

1.0.3 S&P 500 SPDRs (SPY 60 min), 1.2.3 Diamonds (DIA 60 min), RSI overbought.  Of course, RSI sometimes can stay as overbought for very long.  However, this doesn't happened recently according to the chart even during the mad rally after July 15th.  Therefore in term of probability, the market is due for a pullback tomorrow.

6

1.0.4 S&P 500 SPDRs (SPY 15 min), 1.1.A PowerShares QQQ Trust (QQQQ 15 min), 1.2.7 Diamonds (DIA 15 min).  You may notice that the second day pullback has been accurately predicted by the negative divergence of MACD and RSI on the 15-min chart.  As a result, tomorrow the market will likely pull back.

7

1.4.3 S&P/TSX Composite Index (15 min).  MACD and RSI show negative divergence on the Canada market.  The prediction yesterday is inaccurate.  Tomorrow it might pull back.

3.0.3 20 Year Treasury Bond Fund iShares (TLT Daily).  STO is overbought and TLT is due for a pullback.  Take notice that Bond is not always anti-correlated with the stock market (denoted by SPX).  Therefore it is normal that Bond went up today with the rising of the stock market.

8

2.0.0 Volatility Index - NYSE (Daily).  VIX didn't go down much.  Just for your information.

Thursday, August 28, 2008

08/27/2008 Market Recap: No Direction

The only useful conclusion today is: there are a few bearish signals but they are not deterministic.  If the market does not correct these signals but rises further, it will be a good chance to short.

2.3.3 NYSE Total Volume.  It went down further and looks very bearish.  Some people may claim this is connected with the labor day long weekend, but it wasn't like this in the end of last August on the chart.

1

2.3.4 Nasdaq Total Volume/NYSE Total Volume.  It is a bit too high and won't look good if QQQQ rises tomorrow.

2

2.8.1 CBOE Options Total Put/Call Ratio.  It is merely 0.82 which is too bullish.  If CPC dives down tomorrow, the situation will not be good.

3

By the way, recently the momentum has been quite weak, and the breadth indicators often give bearish warnings.  On the other hand, it is interesting that no mid-term sell signal ever shows up on 0.0.0 Signal Watch and Daily Highlights.  Take a look at the following chart, it is green, isn't it?

4

In addition, 2.3.0 NYSE High-Low Index is too close to the oversold region.  Consequently the downside space is limited even the market violently sells off from now on.

5

Therefore, at the moment I am not sure whether the market will go up or down in the mid-term, most likely SPX will oscillate between 1260 and 1290 until a breaking event happens.

As aforementioned, the market would better to correct a bit in order to be bullish in the mid-term.  Will it go up or down tomorrow?  There is no deterministic signal, although I incline to up first and then down.

Here is the reason why the market may go down eventually tomorrow.  Note the volume pattern, if the volume doesn't keep up during the second day's rally, the third day may likely be a down day.

6

1.0.4 S&P 500 SPDRs (SPY 15 min), 1.1.A PowerShares QQQ Trust (QQQQ 15 min), 1.2.7 Diamonds (DIA 15 min).  These 15-min charts show why the market pulled back several times.  The pattern on last Friday looks like an Island Reversal and the gap should be a resistance.  However, MACD and RSI don't show negative divergence so the market could go up in the morning and probably will break today's high, such that MACD and RSI will show negative divergence and finally the market will roll over.

7

1.4.3 S&P/TSX Composite Index (15 min).  In order to have a better understanding of negative divergence of MACD and RSI, let's take a look at the Canada market.  On the chart, MACD and RSI have formed negative divergence, so the probability of selling-off tomorrow is high.  You may also take a look at 3.3.0 streetTRACKS Gold Trust Shares (GLD Daily) and 3.4.1 United States Oil Fund, LP (USO Daily).  A black candle, which often means reversal, shows up on the daily charts of gold and oil.  This isn't a good news to TSX which is heavily influenced by gold and oil.  In plain English, tomorrow TSX may fall.

8

1.4.4 TSE McClellan Oscillator.  This chart has improved significantly.  Note that the black candles in the middle is rising finally.  At the same time, the golden candles (refers to new 52 weeks low) at the background of black candles are falling continuously, which is also a good sign.  TSX market is gaining strength.

9

Wednesday, August 27, 2008

08/26/2008 Market Recap: Support held, bulls still have chances

There is no significant signal today, so here is a short report.

0.0.1 Simple SPY Trading System.  Small candle after a big candle is a typical consolidation, but the breakout direction is unknown.  On the chart, bulls are on the edge of cliff.  If the market breaks out downward it will be quite bad.  So keep an eye on the support at 126.50, which has to hold.  The trading rule of consolidation is on the chart 8.1.0 Small Body Bar Trading Rule.

1

Will the support hold tomorrow?  I guess yes.

1.0.4 S&P 500 SPDRs (SPY 15 min), 1.1.A PowerShares QQQ Trust (QQQQ 15 min), 1.2.7 Diamonds (DIA 15 min), 1.3.6 Russell 2000 iShares (IWM 15 min).  On 15-min charts of all major indices there is a common pattern: MACD and RSI positive divergence.  Do you remember that the rebound of market in the morning was predicted according to this pattern yesterday?  The consolidation today has made the positive divergence more significant.  You can take a look what happened after similar kind of positive divergence.  Furthermore, the yellow region is quite encouraging because it should provide good support because of heavy trading volume.

2

2.3.0 NYSE High-Low Index.  In case the support doesn't hold tomorrow, this indicator is very close to the oversold region.  Note that every time the black line reaches the oversold region marked by the green horizontal line, the pale green line denoted the market will bounce back in the near term, no exception so far.  Therefore, even if the support breaks, it won't be terrible since the market may bounce back in the near term.  On the other hand, by no means I suggest not to cut loss once the support is broken but only doubt the magnitude of selling-off after the broken support.

3

Monday, August 25, 2008

08/25/2008 Market Recap: Support Still Holds

In the weekend report, I said that it would be a good chance to short if today the market went up, on the other hand if the market went down we would see if the support still hold, and the uptrend would be still intact if the support hold.

0.0.1 Simple SPY Trading System, support hasn't been touched yet.  So it is unconfirmed if this is a another leg down before tomorrow's market close.

1

Will the support break tomorrow?  Maybe, maybe not, at least in the morning the market may bounce back according to the chart.

1.0.4 S&P 500 SPDRs (SPY 15 min). In the yellow region it's a 3-day consolidation which provides a good support, at the same time MACD and RSI show positive divergence which means the downward momentum is not strong enough, so tomorrow morning the market may bounce back. 1.1.A PowerShares QQQ Trust (QQQQ 15 min), 1.2.7 Diamonds (DIA 15 min), on these two charts MACD and RSI show positive divergence as well.  1.3.2 Russell 2000 iShares (IWM 60 min) On the Russel 2000 60-min chart MACD and RSI show positive divergence.

2

1.1.C TRINQ Trading Setup.  This time its prediction is correct, so let's use it one more time.  Today TRINQ is almost 3.0, so tomorrow the market should bounce back.

3

3.0.3 20 Year Treasury Bond Fund iShares (TLT Daily), breakout, but such a gap up Doji looks exhausted.  Furthermore, a black candle has a high chance of reversal.  Therefore tomorrow TLT may pullback which is bullish to the stock market.

4

As a summary, tomorrow bulls may see some hope.

Sunday, August 24, 2008

08/22/2008 Market Recap: Two potential topping signals

Firstly here is the conclusion: next week the market may start another ledge down to test the July 15 low. If the market rallies on Monday and Tuesday, do not chase high. If it pulls back on Monday and Tuesday, check the trend strength according to the following chart -- if support denoted by the red line still holds during the three days of pullback, maybe the uptrend is ok and buying dip is fine.

1

I have concern to two indicators, which positions are certainly bearish to bulls and at least means the upside room is limited.

2.0.2 Volatility Index 30-day/90-day Ratio. The way to read this chart has been introduced in How to Read Breadth Charts in Cobra's Market View. Some may say the reliability of this chart is not high because of its short history. However, think about the 90-day expected volatility is much higher than the current volatility, it means the mid-term trend is upward, doesn't it?

2

2.3.3 NYSE Total Volume. Some people may have different opinions on this chart. But we have to admit that the market is going in a similar way with the one in this May -- prices going up and volume going down, which means the institutions are not heavily involving and the current rally is not a broad based one. If this situation goes not change, the rally will not be sustainable.

3

Now let's read the weekly chart.

1.0.1 S&P 500 Large Cap Index (Weekly), 1.2.1 Dow Jones Industrial Average (Weekly). Very likely the pattern is a Bearish Rising Wedge.

4

1.1.2 Nasdaq Composite (Weekly). It has been blocked by the primary downtrend line for two weeks. My feeling is bearish because of the fact that a Hanging Man like candle shows up at the key resistance. The RSI indicator at the top of the chart looks like a pivot point in a bear market.

5

3.1.1 US Dollar Index (Weekly). US dollar has been pushing up the stock market, now it is facing the resistance on STO.

6

3.2.1 Japanese Yen (Weekly). Japanese Yen is the opposite as it is on the STO support. The combination of weak 3.1.1 and strong 3.2.1 seems bearish to the stock market.

7

3.4.2 United States Oil Fund, LP (USO Weekly). The oil is on the support of STO.

8

3.3.1 streetTRACKS Gold Trust Shares (GLD Weekly). Similarly, GLD is on the STO support, too. The means the commodity may bounce back which is bearish to the stock market.

9

According to aforementioned analysis, the mid-term trend is bearish.

What about the near-term trend, e.g. the next week? I am not sure if there will be a pivot point. On the daily chart, SPX and INDU may start pullback on Monday, on the other hand QQQQ and IWM may continue higher.

1.3.7 Russell 3000 Dominant Price-Volume Relationships. The dominant price-volume relationship is 1348 stocks price up volume down, so the chance of market down on Monday or Tuesday is very high.

0.0.1 Simple SPY Trading System. Price went up for three days but volume kept going down. For this pattern, on the fourth day which is the next Monday, the probability of down is high. Note the VIX ENV, SPY on 15-min chart may be a Ascending Triangle so it might break upward but this would cause VIX breaks ENV. On 0.0.2 Market Top/Bottom Watch, every time VIX break ENV downward the market is potentially topped. Therefore if the market rallies next Monday, I will consider it a good opportunity to short.

10

1.0.3 S&P 500 SPDRs (SPY 60 min), 1.2.3 Diamonds (DIA 60 min). On the charts, the Friday rally looks like a typical testing back the breakout point after a breakout of the rising wedge.

11

1.0.4 S&P 500 SPDRs (SPY 15 min), 1.2.7 Diamonds (DIA 15 min). The patterns look like a Ascending Triangle but MACD and RSI shows a bit of negative divergence. Considered that the breakout of ascending triangle is dual directional, likely this time it will breakout downward. I am saying it is impossible to break out upward, however shorter time frame will be overridden by longer time frame if the latter (e.g. the daily chart) is bearish. I wish it could break out upward -- because that would be a perfect short entry since the big trend is down and upward breakout means four days of rally.

12

1.1.6 PowerShares QQQ Trust (QQQQ Daily), 1.3.0 Russell 2000 iShares (IWM Daily). Morning Star, so the probability of further rally is very high.

13

1.1.C TRINQ Trading Setup. This chart says QQQQ may pull back on Monday. My statistics shows that the edge of TRINQ setup is marginal. If the chart is inaccurate again on Monday, the success rate is merely 61% and the edge is indeed small. Then I will drop it. Let's give this chart one more chance.

Disclaimer

The information contained on this website and from any communication related to the author’s blog and chartbook is for information purposes only. The chart analysis and the market recap do not hold out as providing any financial, legal, investment, or other advice. In addition, no suggestion or advice is offered regarding the nature, profitability, suitability, sustainability of any particular trading practice or investment strategy. The materials on this website do not constitute offer or advice and you should not rely on the information here to make or refrain from making any decision or take or refrain from taking any action. It is up to the visitors to make their own decisions, or to consult with a registered professional financial advisor.

This websites provides third-party websites for your convenience but the author does not endorse, approve, or certify the information on other websites, nor does the author take responsibility for a part or all materials on the third-party websites which are not maintained by the author.