Live Update

Monday, February 28, 2011

02/28/2011 Market Recap: New High Wanted Tomorrow

  TREND MOMENTUM COMMENT
Long-term 2 of 2 are BUY  
Intermediate 3 of 5 are SELL 5 of 5 are NEUTRAL SPY ST Model in BUY mode; Non-Stop in SELL mode.
Short-term 6 of 6 are NEUTRAL
GANN DAY MOON:SOLAR CYCLE CONCLUSION
03/05-03/09 03/04 : 03/06 Next pivot date: 03/06
BULLISH 09/27 Market Recap: 9 POMO within 20 trading days means 14%+ up in 3 months.
4.1.0 S&P 500 Large Cap Index (Weekly): Cup with Handle, target 1428.
6.2.2b VIX Trading Signal (BB): Buy setup triggered on 02/24.
0.1.0 SPY Short-term Trading Signals: A few short-term long signal triggered on 02/23.
BEARISH 4.0.4 Dow Theory: Averages Must Confirm: BPSPX is way too overbought.
4.0.1 SPX Long-term Trading Signals: Weekly EMA(13) is way too high above weekly EMA(34).
4.1.0 S&P 500 Large Cap Index (Weekly): Price is now too high above MA(200).
SPY SETUP ENTRY DATE STOP LOSS INSTRUCTION: Mechanic signals, back test is HERE, signals are HERE.
TRADING PLATFORM:
SSO/SDS, UPRO/SPXU
Non-Stop 02/24 S N/A 02/23: Close long and sell short, can wait for a few days to avoid whipsaw.
ST Model 02/25 L *Breakeven  *Adjust stop loss.
Short-term *UP 02/18 High
02/24 Low
Hold both short and long until stop loss being hit.
My Thoughts The pullback since 02/22 will last awhile but the 02/18 high will be visited in 69 calendar days on average.

SHORT-TERM: IF NO NEW HIGH TOMORROW, THEN BEAR MAY STILL HAVE CHANCES

Nothing to say today, let’s see tomorrow. If up again but couldn’t make a new high then according to the “n vs n” rule, for the equally 3 trading days, bears advanced more therefore by definition this is a sellable bounce so bears may still have hopes no matter whether we see a new high the day after tomorrow or not.

NvsN

Just a reminder, statistically, pivot point usually happens in March. For now, if indeed, the coming March should be a pivot top.

TurningMarch

INTERMEDIATE-TERM: PULLBACK SINCE 02/22 COULD LAST 4 WEEKS ON AVERAGE, THE 02/18 HIGH WILL BE REVISITED THEREAFTER

See 02/23 Market Recap for more details.

SEASONALITY: FIRST TRADING DAY IN MARCH COULD BE VERY BULLISH

See 02/25 Market Recap for more details.

HIGHLIGHTS OF THE OTHER ETFS IN MY PUBLIC CHART LIST

SIGNAL COMMENT
QQQQ 01/28 S
NDX Weekly UP
IWM
IWM Weekly UP
CHINA
CHINA Weekly UP No higher low yet but the rebound is so strong so could be in uptrend now.
EEM
EEM Weekly DOWN
XIU.TO 02/04 L
XIU.TO Weekly UP
TLT Could be a channel breakout, trend may about to change.
TLT Weekly ?
FXE
FXE Weekly UP
GLD
GLD Weekly UP
GDX 02/03 L
GDX Weekly UP
USO Clear breakout on WTIC chart.
WTIC Weekly UP
XLE 02/09 S
XLE Weekly UP Too far above MA(200).
XLF 10/15 L
XLF Weekly UP
IYR
IYR Weekly UP
XLB 02/09 S
XLB Weekly UP

  1. Please make sure you understand how to use the table above. The purpose of this report is to provide info so contradictory signals are always presented.
  2. Conclusions can be confirmed endlessly, but trading wise, you have to take actions at certain risk level as soon as you feel the confirmation is enough. There’s no way for me to adapt to different risk levels therefore no trading signals will be given in this report except the mechanical signals such as SPY ST Model.
  3. * = New update; Blue Text = Link to a chart in my public chart list.
  4. Trading signals in OTHER ETFs table are mechanical signals. See HERE for back test results. 08/31 L, for example, means Long on 08/31.
  5. UP = Intermediate-term uptrend. Set when I see at least one higher high and higher low on daily chart.
  6. DOWN = Intermediate-term downtrend. Set when I see at least one lower high and lower low on daily chart.

02/28/2011 After Bell Quick Summary

The bottom line, the short-term trend is up. I hold both long and short overnight for trying a new strategy.

As mentioned in the weekend report, tomorrow should be very very bullish. There’s a slightly trick though as it seems the 1st down 1st month day was after 5 consecutive up 1st month day then the 2nd down 1st month day was after 6 consecutive up 1st month day, so presumably the 3rd down 1st month day could start after 7 consecutive up 1st month day which is tomorrow? Confused? LOL. Nothing serious, just trying to look smart here, because strictly according to TA principle, we should never think this time is different, so I’ll still assume a very very bullish tomorrow.

 1 

Demo account for short-term model, $200 max loss allowed per trade. Mechanical trading signal, for fun only.
TICKER Entry Date Entry Price Share Stop Loss Exit Date Exit Price Profit Comment
SSO 02/28/2011 $53.09 100 $52.20 New strategy, half positioned.
SSO 02/25/2011 $52.54 100 $50.84 02/25/2011 $52.95 41.00  
SDS 02/22/2011 $21.05 300 $20.62 Trying new strategy, so still hold.
SDS 02/22/2011 $21.05 200 $20.62 02/22/2011 $21.55 100.00 Partial profit.
SSO 02/17/2011 $54.05 200 $53.26 02/17/2011 $54.49 88.00  
SSO 02/16/2011 $54.08 300 $53.78 02/16/2011 $54.28 60.00  
SSO 02/15/2011 $53.68 100 $52.18 02/16/2011 $53.95 27.00 Target met.
SSO 02/11/2011 $52.87 100 $52.18 02/16/2011 $53.86 99.00 Too nervous, shouldn’t close this.
SSO 02/11/2011 $52.87 100 $51.78 02/11/2011 $53.36 49.00 Partial profit to lock SDS losses.
SDS 02/10/2011 $21.68 500 $21.27 02/11/2011 $21.29 -195.00  
SSO 02/09/2011 $52.91 200 $51.84 02/10/2011 $53.03 24.00  
SSO 02/07/2011 $52.67 400 $52.10 02/07/2011 $52.84 68.00 Rare case for low risk entry.
SSO 02/04/2011 $51.78 200 $50.81 02/04/2011 $51.98 40.00  
SSO 02/02/2011 $51.72 200 $50.69 02/03/2011 $51.86 28.00  
SSO 02/01/2011 $51.03 50 $51.23 02/02/2011 $51.62 29.50  
SSO 02/01/2011 $51.03 50 $49.23 02/01/2011 $51.46 21.50 Partial profit to lock SDS losses.
SDS 01/31/2011 $22.77 300 $22.09 02/01/2011 $22.09 -204.00  
JAN 415.00  
SUM 691.00  

02/28/2011 Intraday Watering Thread

http://www.cobrasmarketview.com/viewtopic.php?f=2&t=39

Saturday, February 26, 2011

02/25/2011 Market Recap: Still expect a 2nd leg down

  TREND MOMENTUM COMMENT
Long-term 2 of 2 are BUY  
Intermediate 3 of 5 are SELL 5 of 5 are NEUTRAL SPY ST Model in BUY mode; Non-Stop in SELL mode.
Short-term 6 of 6 are NEUTRAL
GANN DAY MOON:SOLAR CYCLE CONCLUSION
03/05-03/09 03/04 : 03/06 Next pivot date: 03/06
BULLISH 09/27 Market Recap: 9 POMO within 20 trading days means 14%+ up in 3 months.
4.1.0 S&P 500 Large Cap Index (Weekly): Cup with Handle, target 1428.
6.2.2b VIX Trading Signal (BB): Buy setup triggered on 02/24.
0.1.0 SPY Short-term Trading Signals: A few short-term long signal triggered on 02/23.
BEARISH 4.0.4 Dow Theory: Averages Must Confirm: BPSPX is way too overbought.
4.0.1 SPX Long-term Trading Signals: Weekly EMA(13) is way too high above weekly EMA(34).
4.1.0 S&P 500 Large Cap Index (Weekly): Price is now too high above MA(200).
SPY SETUP ENTRY DATE STOP LOSS INSTRUCTION: Mechanic signals, back test is HERE, signals are HERE.
TRADING PLATFORM:
SSO/SDS, UPRO/SPXU
Non-Stop 02/24 S N/A 02/23: Close long and sell short, can wait for a few days to avoid whipsaw.
ST Model *02/25 L  1.9*ATR(10)   
Short-term *UP? 02/18 High Trend is unconfirmed up. Hold/enter short unless stop loss being hit.
My Thoughts The pullback since 02/22 will last awhile but the 02/18 high will be visited in 69 calendar days on average.

SHORT-TERM: DON’T EXPECT STRONG MONDAY, STILL EXPECT A 2ND LEG DOWN ONCE THE CURRENT REBOUND COMPLETES

Although the Friday’s rebound was strong but I still believe there’ll be a 2nd leg down once the rebound is over. However, if another 1%+ up the next Monday, considering that the next Tuesday is the first trading day of March which suppose to be very very (insert 100 very here) bullish, so in this case, no argue, chances would be pretty high that pullback was over, we’ll see a new high.

Let’s begin with why I believe there’ll be a 2nd leg down:

The chart below basically says that since the March 2009 rally, all 2.5%+ pullbacks were 2 legged (down). Strictly speaking, there’s no exceptions. The chart below below marks the “% Change” for every 1st leg down, should be clear that our current 1st leg down is within the normal range so it’s reasonable to expect a 2nd leg down. (In case you wonder why the initial pullback size could justify a 2 legged pullback? Well, it’s the law of inertia that is beyond discussion of this report)

2ndLegDownPattern
1stLegDownSize

Another evidence was from Schaeffer. VIX rose 35%+ within 2 days, which looks bad thereafter since the March 2009 rally. The statistics from Schaeffer (blue table inside the chart below) also says the next week won’t be pleasant.

VIXSpikesOver35PercentIn2Days

So now the question is whether it is possible for the next Monday to rise huge (therefore potentially invalidates my expectation for the 2nd leg down)? All I can say now are it has 20% chances. Here’s a simple statistics, since the March 2009, whenever SPX down 3 consecutive days (why 3 consecutive down days? See 02/24 Market Recap) then rebound 1%+ one day (that’s Friday), buy at Friday’s close then sell at Monday’s close, looks like there’s only 2 out of 10 chances for a green Monday.

Down3Up1BackTest

Last but not the least, I’d like your attention for three additional things:

0.1.0 SPY Short-term Trading Signals, if you paid attention to the exit conditions in the chart, then most long setups mentioned in the 02/23 Market Recap should have been closed by Friday.

SPYShortTerm

The chart below is from Schaeffer.

NoAggressiveLong

Institutional Buying and Selling Trending chart from StockTiming, the next thing I’d watch closely is whether the distribution curve (red) clearly crosses above the accumulation curve (blue). If indeed in the following days, then according to the past, the pullback caused by such a crossover won’t end within a day or two. This could again supports my expectation for a 2nd leg down.

InstitutionalBuyingSelling

INTERMEDIATE-TERM: PULLBACK SINCE 02/22 COULD LAST 4 WEEKS ON AVERAGE, THE 02/18 HIGH WILL BE REVISITED THEREAFTER

See 02/23 Market Recap for more details.

SEASONALITY: FIRST TRADING DAY IN MARCH COULD BE VERY BULLISH

According to Stock Trader’s Almanac, first trading day in March, Dow down 3 of last 4, –4.2% in 2009, 1996 – 2006 up 9 of 11.

Generally, I’d expect a very bullish March the 1st because according to the table below, ever since the March 2009 rally, the first trading day of the month is very very bullish. Also, for the March seasonality chart please refer to Seasonality – Month.

Bullish1stTradingDayOfMonth

HIGHLIGHTS OF THE OTHER ETFS IN MY PUBLIC CHART LIST

SIGNAL COMMENT
QQQQ 01/28 S
NDX Weekly UP
IWM
IWM Weekly UP
CHINA
CHINA Weekly UP No higher low yet but the rebound is so strong so could be in uptrend now.
EEM
EEM Weekly DOWN
XIU.TO 02/04 L
XIU.TO Weekly UP
TLT Could be a channel breakout, trend may about to change.
TLT Weekly *?
FXE
FXE Weekly UP
GLD
GLD Weekly UP
GDX 02/03 L
GDX Weekly UP
USO Clear breakout on WTIC chart.
WTIC Weekly UP
XLE 02/09 S
XLE Weekly UP Too far above MA(200).
XLF 10/15 L
XLF Weekly UP
IYR
IYR Weekly UP
XLB 02/09 S
XLB Weekly UP

  1. Please make sure you understand how to use the table above. The purpose of this report is to provide info so contradictory signals are always presented.
  2. Conclusions can be confirmed endlessly, but trading wise, you have to take actions at certain risk level as soon as you feel the confirmation is enough. There’s no way for me to adapt to different risk levels therefore no trading signals will be given in this report except the mechanical signals such as SPY ST Model.
  3. * = New update; Blue Text = Link to a chart in my public chart list.
  4. Trading signals in OTHER ETFs table are mechanical signals. See HERE for back test results. 08/31 L, for example, means Long on 08/31.
  5. UP = Intermediate-term uptrend. Set when I see at least one higher high and higher low on daily chart.
  6. DOWN = Intermediate-term downtrend. Set when I see at least one lower high and lower low on daily chart.

Friday, February 25, 2011

02/25/2011 After Bell Quick Summary

The bottom line, the short-term trend is up, not confirmed though. I hold partial short position over the weekend for trying a new strategy as you can see I’m trying to hold some short-term position now so that if the strategy is OK, you might be able to follow in the future.

I have no idea about the next Monday, could be a bearish Rising Wedge in the forming so after one more push up (may or may not) we might see a pullback then normally should be another leg up which at the current stage, don’t know how far it could go yet.

SPY15min

Enjoy your weekend! Oh, in case you want to ask, no, today is not an All Up Day. Even it is, it has no edge now.

Demo account for short-term model, $200 max loss allowed per trade. Mechanical trading signal, for fun only.
TICKER Entry Date Entry Price Share Stop Loss Exit Date Exit Price Profit Comment
SSO 02/25/2011 $52.54 100 $50.84 02/25/2011 $52.95 41.00  
SDS 02/22/2011 $21.05 300 $20.62 Trying new strategy, so still hold.
SDS 02/22/2011 $21.05 200 $20.62 02/22/2011 $21.55 100.00 Partial profit.
SSO 02/17/2011 $54.05 200 $53.26 02/17/2011 $54.49 88.00  
SSO 02/16/2011 $54.08 300 $53.78 02/16/2011 $54.28 60.00  
SSO 02/15/2011 $53.68 100 $52.18 02/16/2011 $53.95 27.00 Target met.
SSO 02/11/2011 $52.87 100 $52.18 02/16/2011 $53.86 99.00 Too nervous, shouldn’t close this.
SSO 02/11/2011 $52.87 100 $51.78 02/11/2011 $53.36 49.00 Partial profit to lock SDS losses.
SDS 02/10/2011 $21.68 500 $21.27 02/11/2011 $21.29 -195.00  
SSO 02/09/2011 $52.91 200 $51.84 02/10/2011 $53.03 24.00  
SSO 02/07/2011 $52.67 400 $52.10 02/07/2011 $52.84 68.00 Rare case for low risk entry.
SSO 02/04/2011 $51.78 200 $50.81 02/04/2011 $51.98 40.00  
SSO 02/02/2011 $51.72 200 $50.69 02/03/2011 $51.86 28.00  
SSO 02/01/2011 $51.03 50 $51.23 02/02/2011 $51.62 29.50  
SSO 02/01/2011 $51.03 50 $49.23 02/01/2011 $51.46 21.50 Partial profit to lock SDS losses.
SDS 01/31/2011 $22.77 300 $22.09 02/01/2011 $22.09 -204.00  
JAN 415.00  
SUM 691.00  

02/25/2011 Intraday Comment Thread

http://www.cobrasmarketview.com/viewtopic.php?f=2&t=36

Thursday, February 24, 2011

02/24/2011 Market Recap: All pullbacks start with 3 consecutive down days

  TREND MOMENTUM COMMENT
Long-term 2 of 2 are BUY  
Intermediate 3 of 5 are SELL 4 of 5 are NEUTRAL SPY ST Model in BUY mode; Non-Stop in SELL mode.
Short-term 6 of 6 are NEUTRAL
GANN DAY MOON:SOLAR CYCLE CONCLUSION
02/20 02/18 : 02/19 02/19 Next pivot date: 02/20
BULLISH 09/27 Market Recap: 9 POMO within 20 trading days means 14%+ up in 3 months.
4.1.0 S&P 500 Large Cap Index (Weekly): Cup with Handle, target 1428.
*6.2.2b VIX Trading Signal (BB): Buy setup triggered on 02/24.
0.1.0 SPY Short-term Trading Signals: A few short-term long signal triggered on 02/23.
BEARISH 4.0.4 Dow Theory: Averages Must Confirm: BPSPX is way too overbought.
4.0.1 SPX Long-term Trading Signals: Weekly EMA(13) is way too high above weekly EMA(34).
4.1.0 S&P 500 Large Cap Index (Weekly): Price is now too high above MA(200).
02/14 Market Recap: Smart/Dumb Money Confidence spread is too large.
SPY SETUP ENTRY DATE STOP LOSS INSTRUCTION: Mechanic signals, back test is HERE, signals are HERE.
TRADING PLATFORM:
SSO/SDS, UPRO/SPXU
Non-Stop 02/24 S N/A 02/23: Close long and sell short, can wait for a few days to avoid whipsaw.
ST Model     *Long if up day tomorrow. The stop loss is 1.9*ATR(10).
Short-term N/A Trend is DOWN. I hold partial short position overnight.
My Thoughts The pullback since 02/22 will last for awhile but the 02/18 high will be visited again.

SHORT-TERM: THE 1ST DOWN LEG COULD HAVE COMPLETED

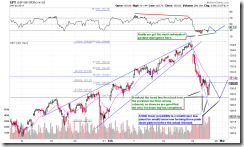
As mentioned in today’s intraday comment, RSI positive divergence plus breakout trend line then back test the previous low then strong rebound is a typical reversal pattern, so chances are good that the very 1st down leg has completed. The initial rebound target is Fib 38.2 as above it, the resistance will become tougher and tougher. The chart below also listed another lower possibility that we might have a small lower low tomorrow, so if you bought dip today, beware this little trick.

SPY60min

Two additional stuff for your attention:

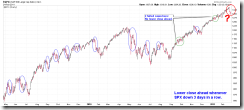
Since the March 2009 rally, all pullbacks began with 3 consecutive down days, so another evidence, if a rebound tomorrow, there could be a 2nd leg down thereafter.

3ConsecutiveDownDays

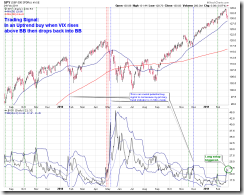
6.2.2b VIX Trading Signal (BB), 6.2.0a VIX Trading Signals (ENV), VIX long setup has been triggered today.

VIXBBLongSetup

INTERMEDIATE-TERM: PULLBACK SINCE 02/22 COULD LAST 4 WEEKS ON AVERAGE, THE 02/18 HIGH WILL BE REVISITED THEREAFTER

See 02/23 Market Recap for more details.

SEASONALITY: BEARISH THE NEXT WEEK

See 02/18 Market Recap for more details.

HIGHLIGHTS OF THE OTHER ETFS IN MY PUBLIC CHART LIST

SIGNAL COMMENT
QQQQ 01/28 S Testing MA(50).
NDX Weekly UP
IWM Testing MA(50).
IWM Weekly UP
CHINA
CHINA Weekly UP No higher low yet but the rebound is so strong so could be in uptrend now.
EEM
EEM Weekly DOWN
XIU.TO 02/04 L
XIU.TO Weekly UP Too far above MA(200), %B too high.
TLT Could be a channel breakout, trend may about to change.
TLT Weekly DOWN
FXE
FXE Weekly UP
GLD
GLD Weekly UP
GDX 02/03 L
GDX Weekly UP
USO Clear breakout on WTIC chart.
WTIC Weekly UP
XLE 02/09 S
XLE Weekly UP Too far above MA(200).
XLF 10/15 L Testing MA(50).
XLF Weekly UP
IYR
IYR Weekly UP
XLB 02/09 S
XLB Weekly UP BPMATE is way too overbought.

  1. Please make sure you understand how to use the table above. The purpose of this report is to provide info so contradictory signals are always presented.
  2. Conclusions can be confirmed endlessly, but trading wise, you have to take actions at certain risk level as soon as you feel the confirmation is enough. There’s no way for me to adapt to different risk levels therefore no trading signals will be given in this report except the mechanical signals such as SPY ST Model.
  3. * = New update; Blue Text = Link to a chart in my public chart list.
  4. Trading signals in OTHER ETFs table are mechanical signals. See HERE for back test results. 08/31 L, for example, means Long on 08/31.
  5. UP = Intermediate-term uptrend. Set when I see at least one higher high and higher low on daily chart.
  6. DOWN = Intermediate-term downtrend. Set when I see at least one lower high and lower low on daily chart.

Disclaimer

The information contained on this website and from any communication related to the author’s blog and chartbook is for information purposes only. The chart analysis and the market recap do not hold out as providing any financial, legal, investment, or other advice. In addition, no suggestion or advice is offered regarding the nature, profitability, suitability, sustainability of any particular trading practice or investment strategy. The materials on this website do not constitute offer or advice and you should not rely on the information here to make or refrain from making any decision or take or refrain from taking any action. It is up to the visitors to make their own decisions, or to consult with a registered professional financial advisor.

This websites provides third-party websites for your convenience but the author does not endorse, approve, or certify the information on other websites, nor does the author take responsibility for a part or all materials on the third-party websites which are not maintained by the author.