Live Update

Saturday, October 8, 2011

The latest Market Outlook is posted on cobrasmarketview.com

Ladies and gentlemen , it’s time to move on! Today’s report is posted on www.cobrasmarketview.com. And from now on I’ll post all my reports on that new site, please take a little more step there to warm up my new site. Thanks!

I’ve added a portfolio report as a daily routine report.

I’ve put all the resources I currently offer but scattered everywhere together, now you can easily find the chart book, the intraday comment and the poll on the top menu bar.

There’re lots of good articles that can be accessed via Getting Started menu. I’ll keep adding my experiences under that menu.

I’ll from now on do more studies and put them under the Studies menu.

The last but not the least, the comment system is still Disqus, so those who like to comment a lot, which I really appreciate, would feel no pain from the new change.

Thanks again and see you at www.cobrasmarketview.com

Friday, October 7, 2011

10/07/2011 Trading Signals

SHORT-TERM MODEL THINKS THE TREND IS UP, HOLDING BOTH SHORT (TRAPPED) AND LONG OVER THE WEEKEND

The bottom line, bears finally see some light at the other side of the tunnel, just hopefully it’s not the light of a roaring incoming train. Although such odds (roaring train) are low (which as usual, I’ll present my witnesses in the weekend report) but there’s no sure thing in the stock market, so let’s see what the next week brings us before waving your claws.

I have no idea about the next Monday, seems since the Aug lows, we had more green Mondays.

1

Enjoy your weekends! And my fellow Canadians, happy Thanksgiving!

MECHANICAL TRADING SIGNALS
SPY SYSTEM ENTRY STOP LOSS Current 2*ATR(10) value: SSO=12%; SDS=12%; UPRO=18%;SPXU=18%
Non-Stop 09/23 S N/A  
Cobra Impulse *For SPY, put a GTC limit buy 15 cents above 10/04 low. Stop loss = 1.7*ATR(10).

3

10/07/2011 Intraday Comment Thread

http://bbs.cobrasmarketview.com/viewtopic.php?f=2&t=323

Thursday, October 6, 2011

10/06/2011 Market Outlook (Higher High Ahead)

SHORT-TERM: HIGHER HIGH AHEAD

Nothing to say, at least there’ll be one more push up, because rarely, if never, was a Major Accumulation Day exactly the market top.

MAD

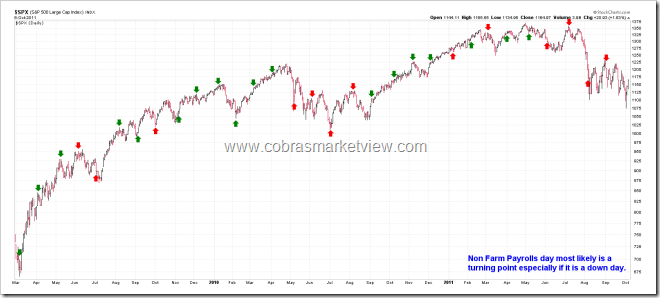
Tomorrow is the famous monthly Non Farm Payroll day. The intraday pattern is open high go lower or open low go higher. The chart below shows all the Non Farm Payroll days since the year 2009 bull market, looks like the chances for bulls and bears are 50 to 50 tomorrow, although 4 consecutive reds recently.

NFP

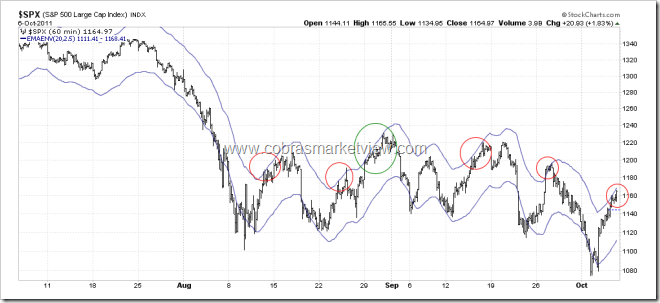
A little speculation about tomorrow’s open: Because of the gravity, there’s a limit on how far a price can move away from MA. For SPX 60 min chart, EMA ENV(20, 2.5) seems the up limit. Today it closed almost on the limit, so if huge gap up open tomorrow, it’d be out of the limit therefore whether such a gap could hold is questionable, especially we all know that the typical Non Farm Payroll intraday pattern is open high go lower or open low go higher.

EMAENV

INTERMEDIATE-TERM: SPX DOWNSIDE TARGET  IS 1,000, THE CORRECTION COULD LAST 1 TO 2 MONTHS

See 08/19 Market Outlook and 09/30 Market Outlook for details.

SEASONALITY: BEARISH MONDAY, BULLISH OCTOBER AND 4TH QUARTER

See 09/30 Market Outlook for details. The outlook also includes the October day to day seasonality chart.

SUMMARY OF SIGNALS FOR MY  PUBLIC CHART LIST: 

TREND MOMENTUM COMMENT
Long-term 3 of 3 SELL
Intermediate 5 of 5 SELL 3 of 5 NEUTRAL Cobra Impulse in SELL mode; Non-Stop in SELL mode.
Short-term UP 6 of 6 NEUTRAL
  TREND COMMENT
QQQ & Weekly DOWN  
IWM & Weekly DOWN  
SSEC & Weekly DOWN  
XIU & Weekly DOWN  
DAX & Weekly DOWN  
TLT & Weekly UP  
UUP & Weekly UP  
GLD & Weekly DOWN  
USO & Weekly DOWN  
  • * = New update; Blue Text = Link to a chart in my public chart list.
  • UP = Intermediate-term uptrend. Set when weekly buy signal is triggered.
  • DOWN = Intermediate-term downtrend. Set when weekly sell signal is triggered.

10/06/2011 Trading Signals

SHORT-TERM MODEL THINKS THE TREND IS UP, HOLDING BOTH SHORT (TRAPPED) AND LONG OVERNIGHT

First of all, again, take sometime to vote HERE, now it’s getting interesting, how many of you really think the low was in?!

The bottom line, as I said in the last night report, nothing bearish works. I don’t know how long this would last, hopefully forever though, as I dreamed of my yacht again last night, it was really huge and beautiful...

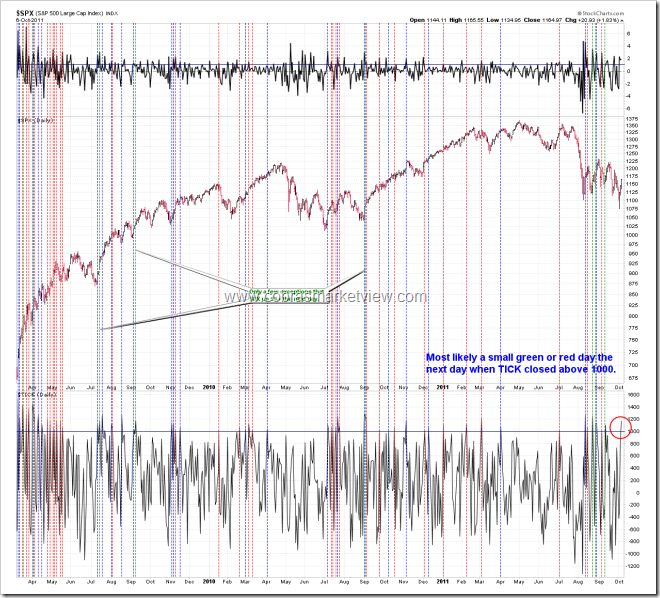
TICK closed above 1,000 so chances are tomorrow won’t be another 1%+ up day if not red.

2

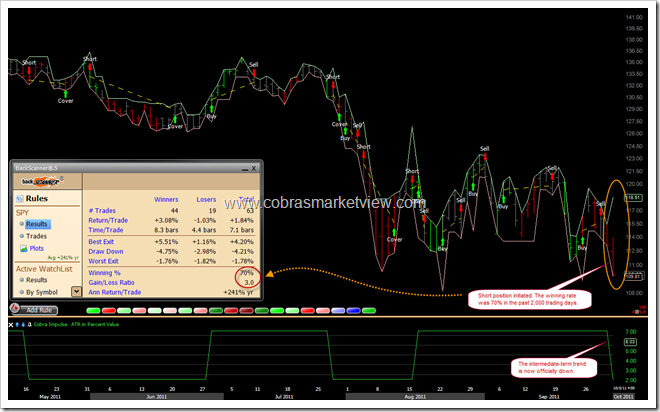
A short setup is triggered today: SPY up 3 days in a row while volume down 2 days, short at today’s close, seems worked pretty well recently.

1

MECHANICAL TRADING SIGNALS
SPY SYSTEM ENTRY STOP LOSS Current 2*ATR(10) value: SSO=12%; SDS=13%; UPRO=18%;SPXU=19%
Non-Stop 09/23 S N/A  
Cobra Impulse *For SPY, put a GTC limit buy 15 cents above 10/04 low. Stop loss = 1.7*ATR(10).

3

10/06/2011 Intraday Comment Thread

http://bbs.cobrasmarketview.com/viewtopic.php?f=2&t=322

Wednesday, October 5, 2011

10/05/2011 Market Outlook (Sep 12 and 13 once more?)

SHORT-TERM: STATISTICALLY BEARISH FOR THE NEXT COUPLE OF DAYS, BUT I’M NOT SURE

First of all, my apology to ID “valunvstr”. He sent me a message explaining what happened yesterday was a misunderstanding. I think I own him an apology that I mistakenly thought he was someone else. I hope my formal apology could clear his name and make him come back to comment more. And my sincere thanks for those who stood behind me yesterday, really really appreciate.

I have 3 more signals suggesting not very pleasant tomorrow or the day after tomorrow, plus all the statistics mentioned in 10/04 Market Outlook, looks like odds are high that tomorrow or the day after tomorrow wouldn’t be pleasant. However, frankly, at the current stage, I have no confidences in those signals. Because:

  1. The rebound from an important bottom, usually lasts at least 7 days, up 6 out of 7 (so called 7 days rule), during which period, nothing bearish would ever work.
  2. The very unique thing yesterday and today are astonishingly similar to Sep 12 and Sep 13. As the later day rally statistics mentioned yesterday is exactly the same as in 09/12 Market Recap and the statistics about ISEE Indices & ETFs Only Index, I’d mention later today, is also exactly the same as in 09/13 Market Recap, so I’m afraid that we might repeat what happened from Sep 12 to Sep 16, in another word is, the market would be up every day until the next Monday (which happens to be the very first Q4 ER report, coincidence?).
  3. From the chart below we can see, the rebound happened from Sep 12 to Sep 16 was repeated exactly from Sep 22 to Sep 27, in terms size and time, so according to Measured Move, at least the rebound this time would equal to the previous 2 times in terms of time and size. Personally, I believe it could be even stronger.

SPYEvilPlan

All the above are, of course, speculation only, with no solid evidence, so theoretically we should believe only those statistics and signals, which are more objective, that tomorrow or the day after tomorrow would be unpleasant. Just personally, I have no confidences in such a so called objective conclusion. The reason I sounds reluctant in calling bear is because now the short-term trend is clear up, so against trend signals are hardly reliable, I don’t want you guys to be too bearish simply because of my report. The report itself, however, must be objective, so I cannot pretend that I don’t see something therefore refuse to draw any conclusion that I don’t want to believe. But I can still tell you that sentimentally I might have no confidence. All in all, the goal is to be unbiased but still balanced for those inexperienced traders, hope you all could understand.

Now let’s take a look at those so called objective signals:

ChiOsc is a little too high.

SPY60min

ISEE Indices & ETFs Only Index >= 100, from the statistics below, 72% chances, no later than Friday, everything we gain today and tomorrow would be totally erased. This statistics, as I mentioned above, is exactly the same as I mentioned in the 09/13 Market Recap (that didn’t work at all the last time).

ISEEIndicesOnlyIndex

Today, again, another 1.65%+ rise but still not a Major Accumulation Day, so statistically, short at today’s close, 90% chances bears would win something within 2 days. In fact, since I mentioned the same chart yesterday, so accordingly, if yesterday’s 90% chance still works, all today’s gain should be completely erased by tomorrow.

UpHugeNoMAD

INTERMEDIATE-TERM: SPX DOWNSIDE TARGET  IS 1,000, THE CORRECTION COULD LAST 1 TO 2 MONTHS

See 08/19 Market Outlook and 09/30 Market Outlook for details.

SEASONALITY: BEARISH MONDAY, BULLISH OCTOBER AND 4TH QUARTER

See 09/30 Market Outlook for details. The outlook also includes the October day to day seasonality chart.

SUMMARY OF SIGNALS FOR MY  PUBLIC CHART LIST: 

TREND MOMENTUM COMMENT
Long-term 3 of 3 SELL
Intermediate 5 of 5 SELL 3 of 5 NEUTRAL Cobra Impulse in SELL mode; Non-Stop in SELL mode.
Short-term UP 6 of 6 NEUTRAL
  TREND COMMENT
QQQ & Weekly DOWN  
IWM & Weekly DOWN  
SSEC & Weekly DOWN  
XIU & Weekly DOWN  
DAX & Weekly DOWN  
TLT & Weekly UP  
UUP & Weekly UP  
GLD & Weekly DOWN  
USO & Weekly DOWN  
  • * = New update; Blue Text = Link to a chart in my public chart list.
  • UP = Intermediate-term uptrend. Set when weekly buy signal is triggered.
  • DOWN = Intermediate-term downtrend. Set when weekly sell signal is triggered.

10/05/2011 Trading Signals

SHORT-TERM MODEL THINKS THE TREND IS UP, HOLDING BOTH SHORT (TRAPPED) AND LONG OVERNIGHT

First of all, take a little time to vote for our 2nd poll HERE, thanks.

The bottom line, statistically, tomorrow and the day after tomorrow shouldn’t be pleasant. I’ll present additional evidences in tonight’s report. Personally I ALWAYS have no confidences in those statistics especially if it’s against the short-term trend, so please don’t ask me if I would trade accordingly.

No idea about tomorrow, seasonality is a little little bearish biased because it’s Thursday and from the chart below I can see obviously more red lines than blue lines.

1

MECHANICAL TRADING SIGNALS
SPY SYSTEM ENTRY STOP LOSS Current 2*ATR(10) value: SSO=13%; SDS=12%; UPRO=19%;SPXU=19%
Non-Stop 09/23 S N/A  
Cobra Impulse *For SPY, put a GTC limit buy 15 cents above 10/04 low. Stop loss = 1.7*ATR(10).

2

10/05/2011 Intraday Comment Thread

Sorry, ladies and guys, I forgot today’s link. Hey, there’s no way I simply miss one day unless something bad happens. I never miss a single day for the past 4 years, so by default you should know everything would be there at bbs.cobrasmarketview.com, just I might forget to post the link. Sorry again and see you there!

http://bbs.cobrasmarketview.com/viewtopic.php?f=2&t=320

Tuesday, October 4, 2011

10/04/2011 Market Outlook (Bullish reversal day, but...)

SHORT-TERM: THE LOW COULD BE IN BUT MAY SEE A FEW DAYS OF BACK AND FORTH FIRST

Very strange day today, on one hand, I have enough reliable evidences arguing it won’t be pleasant in the following several days after a later day rally like today, on the other hand, chart pattern as well as enough reliable evidences are arguing that the the low was in. Combining all those evidences together, my guess is the low was in or very close but bulls must prepare for a possible rollercoaster in the next couple of days.

Begin with evidences arguing for the low was in:

The 3 leg down pattern looks completed, especially the characteristics that the 3rd leg is much shorter than the 2nd leg and the huge consolidation area before the 3rd leg, matches perfectly.

3LegDown

Open low, lower low but closer high, today is called bullish reversal day. From the chart below, with almost no exception (green arrows) such a day at least MEANT a short-term bottom.

BullishReversalDay

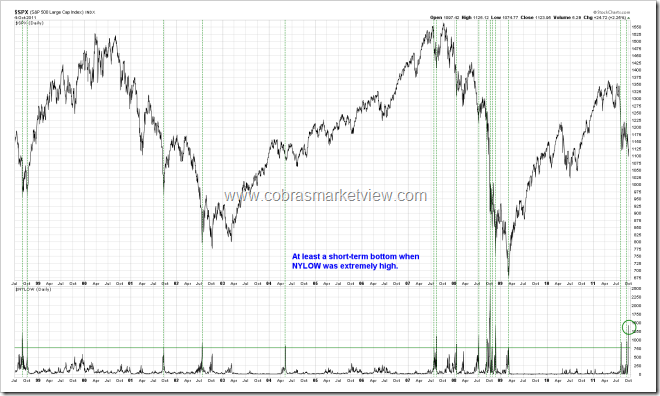
As mention yesterday, some signals cannot be argued. NYLOW around 1,000 is such a signal and today it goes even more extreme, so chances are much higher (than yesterday) that the low was in.
NYLOW

Now let’s see why rollercoaster in the next couple of days:

Later day sharp rally is always suspicious because institutions have not enough time to do the accumulation (therefore hardly such a day WAS a bottom). The statistics below is from Bespoke, looks like chances are high, a red tomorrow and no small drop.

LastHourReversals

SPX up 1%+ but TICK closed below zero, as I've mentioned in 09/26 Market Outlook, tomorrow, the day after tomorrow, the day after the day after tomorrow and two weeks later WERE not pleasant. Let’s play a different test today: short at today’s close, hold (turn the computer off, or shall I see, turn your ipad off?) until the very first SPX red day, the winning rate WAS 100%, average holding period 1.3 trading days and 2.35% gains, not bad ha. In another word, if up huge again tomorrow, then chances are it would be completely erased the day after tomorrow. By the way, I’ve collected all the past similar cases from chart 8.3.8a SPX Up 1% while TICK Closed Red – 2004 to 8.3.8c SPX Up 1% while TICK Closed Red – 2010, take a look if interested, as more often than not you’d miss lots of valuable info if you merely read the numbers instead of looking at the chart directly.

UpHugeOnNegativeTICK

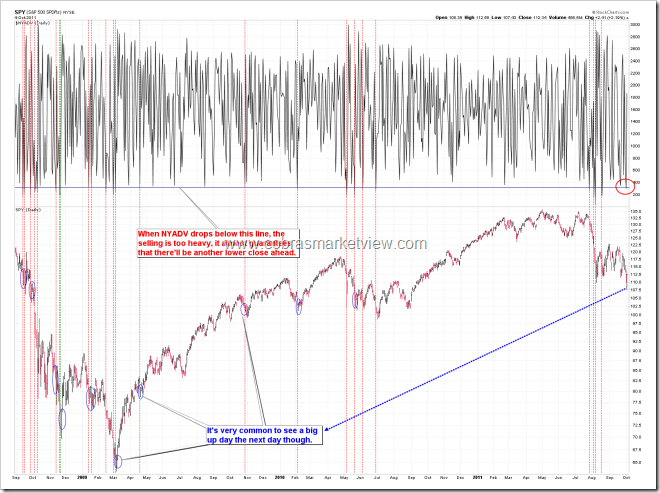
In 10/03 Market Outlook, I mentioned because NYADV too low so a lower close WAS almost guaranteed. If you read the chart carefully, you wouldn’t be surprised that we had a huge up day today, so everything was expected and therefore the forecast that SPX will close below its 10/03 close soon, is still valid, unless it’s another exception again which had 3 out of 24, about 13% chances.
NYADV

SPX up 1.65%+ but not a Major Accumulation Day, although only 68% chances a red day tomorrow, but if you hold until the day after tomorrow, then 90% chances your short at close today would win something.

UpHugeNotMAD

INTERMEDIATE-TERM: SPX DOWNSIDE TARGET  IS 1,000, THE CORRECTION COULD LAST 1 TO 2 MONTHS

See 08/19 Market Outlook and 09/30 Market Outlook for details.

SEASONALITY: BEARISH MONDAY, BULLISH OCTOBER AND 4TH QUARTER

See 09/30 Market Outlook for details. The outlook also includes the October day to day seasonality chart.

SUMMARY OF SIGNALS FOR MY  PUBLIC CHART LIST: 

TREND MOMENTUM COMMENT
Long-term 3 of 3 SELL
Intermediate 5 of 5 SELL 3 of 5 NEUTRAL Cobra Impulse in SELL mode; Non-Stop in SELL mode.
Short-term *UP 6 of 6 NEUTRAL
  TREND COMMENT
QQQ & Weekly DOWN  
IWM & Weekly DOWN  
SSEC & Weekly DOWN  
XIU & Weekly DOWN 1.5.9 TSE McClellan Oscillator: Oversold.
DAX & Weekly DOWN  
TLT & Weekly UP  
UUP & Weekly UP  
GLD & Weekly DOWN  
USO & Weekly DOWN  
  • * = New update; Blue Text = Link to a chart in my public chart list.
  • UP = Intermediate-term uptrend. Set when weekly buy signal is triggered.
  • DOWN = Intermediate-term downtrend. Set when weekly sell signal is triggered.

10/04/2011 Trading Signals

SHORT-TERM MODEL THINKS THE TREND IS UNCONFIRMED UP, HOLDING SHORT POSITION OVERNIGHT

The bottom line, the later day rally is always suspicious, so bull or bear tomorrow is difficult to say, but on a little bit big picture, there’re chances the low was in for at least short-term. I’ll as usual present my witness in tonight’s report.

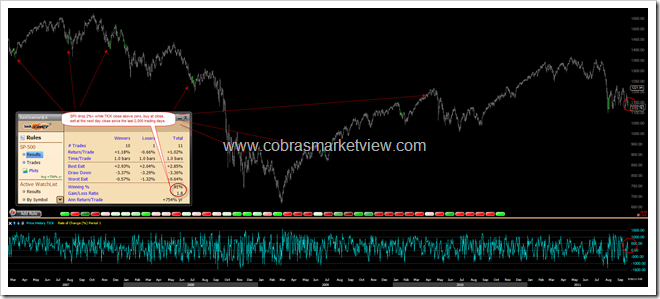
As I mentioned in the intraday comment (a little late, but still better than not mentioning, sorry I forgot to say it this morning as the open almost determined high chances the system would cover everything today), Cobra Impulse System had covered its short position and goes into dip buying mode in which it’d place a GTC limit buy 15 cents (for SPY) above today’s low. Such a dip buying setup had 12 out of 13 wins for the last 2,000 trading days. Click “Cobra Impulse System” to see the back test screenshot for “buying panic low” as trading against trend is always dangerous so I won’t bother to discuss here. And yes, the new web site you see is the future Cobra's Market View.

1

MECHANICAL TRADING SIGNALS
SPY SYSTEM ENTRY STOP LOSS Current 2*ATR(10) value: SSO=13%; SDS=12%; UPRO=20%;SPXU=18%
Non-Stop 09/23 S N/A  
Cobra Impulse 10/03 S 2*ATR(10) *Covered on 10/04 flat.
*For SPY, put a GTC limit buy 15 cents above 10/04 low. Stop loss = 1.7*ATR(10).

2

10/04/2011 Intraday Comment Thread

http://bbs.cobrasmarketview.com/viewtopic.php?f=2&t=319&p=30014#p30014

Monday, October 3, 2011

10/03/2011 Market Outlook (When pattern and signal conflict)

SHORT-TERM: LOWER CLOSE AHEAD

I see conflict between signal and price pattern today:

  • Price pattern wise, it’s a breakdown from a 2 months long consolidation area, which usually means more on the downside, at least it’s the Fib 61.8% Measured Move to SPX 1079ish. Why is that? Because consolidation acts like a spring. Just image how powerful the spring would be after being squeezed for nearly 2 months? Besides, the consolidation area now becomes a formidable resistance that should not be easily broken via the very first rebound attempt.
  • On the other hand, purely from the signal aspect, at least a sizeable rebound is due. Some signals, from my experiences, cannot be argued. And today we have two such signals, NYLOW and 3 Major Distribution Days, both are very reliable.
  • Then how to resolve such a conflict? My experiences are that price pattern usually wins, let alone the target 1079ish is not far away (only one day’s distance as per nowadays dropping speed), plus there’s an additional evidence arguing for a lower close ahead, so my guess is we might go to 1079 first then possibly a huge rebound, instead of the low was in today.

The chart below needs a little experience to FEEL bad. Not experienced enough to feel why, then at least it should be clear how I get the target 1079.

Breakdown

The chart below is why I expect a lower close ahead. The exception is exceptionally rare.

NYADV

The charts below are those I said cannot be argued, a sizeable rebound is due.

Whenever NYLOW (NYSE New 52-Week Lows) closes to 1,000, at least a short-term bottom is close if not already in.

NYLOW

Generally there’d be a huge rebound after 2 to 3 Major Distribution Days. We have 3 Major Distribution Days now, very close to the limit (which was 4). This is perhaps the only indicator that still worked during the darkest period in year 2008.

MADandMDD

INTERMEDIATE-TERM: SPX DOWNSIDE TARGET  IS 1,000, THE CORRECTION COULD LAST 1 TO 2 MONTHS

See 08/19 Market Outlook and 09/30 Market Outlook for details.

SEASONALITY: BEARISH MONDAY, BULLISH OCTOBER AND 4TH QUARTER

See 09/30 Market Outlook for details. The outlook also includes the October day to day seasonality chart.

SUMMARY OF SIGNALS FOR MY  PUBLIC CHART LIST: 

TREND MOMENTUM COMMENT
Long-term 3 of 3 SELL
Intermediate 5 of 5 SELL 3 of 5 NEUTRAL Cobra Impulse in *SELL mode; Non-Stop in SELL mode.
Short-term DOWN 4 of 6 NEUTRAL
  TREND COMMENT
QQQ & Weekly DOWN  
IWM & Weekly DOWN  
SSEC & Weekly DOWN  
XIU & Weekly DOWN *1.5.9 TSE McClellan Oscillator: Oversold.
DAX & Weekly DOWN  
TLT & Weekly UP  
UUP & Weekly UP  
GLD & Weekly DOWN  
USO & Weekly DOWN  
  • * = New update; Blue Text = Link to a chart in my public chart list.
  • UP = Intermediate-term uptrend. Set when weekly buy signal is triggered.
  • DOWN = Intermediate-term downtrend. Set when weekly sell signal is triggered.

10/03/2011 Trading Signals

SHORT-TERM MODEL THINKS THE TREND IS DOWN, HOLDING SHORT POSITION OVERNIGHT

First of all, my congratulations to those who voted “breakdown the Aug 9 lows”, it’s fulfilled today. Hopefully our polls always show “majority rules” instead of the more commonly “minority rules” like most the other polls… P.S. I’ve locked the poll but if you’re still able to vote, please let me know, thanks.

1

Secondly, from now on, I’ll use Excel table for the Demo Account and the future Demo Portfolio (therefore an Excel table is a must now). There’re a little adjustment on the number of shares bought because now everything is calculated automatically. I think it’s fair because even the future gains could be doubled but the loss today was doubled too .

The bottom line, I expect a lower CLOSE ahead (pay attention, it’s not lower low, it’s lower close), will present my witness in tonight’s report.

Cobra Impulse System initiated a short position today and therefore officially argues that the intermediate-term trend is now down.

3

MECHANICAL TRADING SIGNALS
SPY SYSTEM ENTRY STOP LOSS Current 2*ATR(10) value: SSO=13%; SDS=11%; UPRO=21%;SPXU=15%
Non-Stop 09/23 S N/A  
Cobra Impulse *10/03 S 2*ATR(10) *Short initiated on 10/03/2011.
DEMO ACCOUNT FOR SHORT-TERM MODEL (Attention: This is not part of Cobra Impulse System)
2

10/03/2011 Intraday Comment Thread

http://bbs.cobrasmarketview.com/viewtopic.php?f=2&t=318

Saturday, October 1, 2011

09/30/2011 Market Outlook (NYSI Weekly STO Sell Signal)

SHORT-TERM: COULD SEE GREEN MONDAY BUT MAY SEE DIP FIRST

First of all, take a little time to poll here. I plan to do this on regular basis so that we’ll have our own sentiment poll.

If we’re watching a football or soccer game, now bears got the ball and attacking. Let’s see if they can score the next week to end the current trading range, so kind of key week the next week:

  1. Very likely a green Monday, but may first dip below the Friday’s low.
  2. 13 out of 14 (93%) chances, the intermediate-term target is far below the Aug 9 lows. However, in the short-term, I cannot exclude the possibility that  we’ll see a rebound first that could jump as high as 73 SPX points. I’ll discuss this in the Intermediate-term Session.

The chart below is how I read the market:

After apparently 2 leg up, the last attempt to a new high failed, forming a pair of lower high and lower low. This basically confirmed that the rebound was failed, as you Earth people usually, after 2 failures on one direction would then try the opposite direction. Now we need see if bears are able to break the green line below to form another pair of lower high and lower low. Although in 09/23 Market Outlook and 09/26 Market Outlook, I’ve listed enough evidences arguing the ultimate breakdown below 09/22 and 08/09 lows, but I cannot prove that bears would fulfill such a breakdown on this attack. All I can say are, now bears are attacking, therefore get better chances than bulls.

SPXEvilPlan

Why is very likely a green Monday?

  • On Friday, SPX fell more than 2%+ but TICK closed above 0, statistically, 10 out of 11 (91%) chances a green day the next day.

 SPXDown2PercentTICKAboveZero

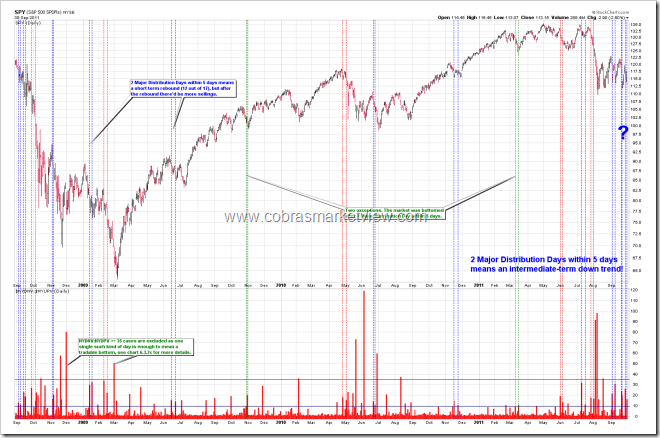
  • I’ve mentioned the chart below in the Friday’s Trading Signals, 2 Major Distribution Days within 5 days means 73% chances a green Monday and likely more rebound in the short-term. This chart, by the way, is one of the reasons why I said above that I cannot exclude the possibility of a huge short-term rebound first.

2MDDWithin5Days

Why will there be a dip below the Friday’s low the next Monday?

  • TRIN closed too high on Friday, almost guarantees a lower low the next day.

TRIN

LLGuaranteed

  • Also, will be mentioning in the Intermediate-term Session, there’re 79% chances, the Friday’s low will be broken the next week.

INTERMEDIATE-TERM: SPX DOWNSIDE TARGET  IS 1,000, THE CORRECTION COULD LAST 1 TO 2 MONTHS

Maintain the SPX 1,000 target, see 08/19 Market Outlook for details. Today, I’d like to add yet another solid evidence.

Presented below is the bears safe zone I mentioned in the 09/29 Market OutlookNYSI Weekly STO sell signal. From the chart, we can draw 4 very useful conclusions:

  1. Strictly speaking, such a sell signal, HAD a 14 out of 14 or 100% successful rate and the most importantly the profits WERE mostly huge, which in another word is, in most cases, the SPX dropped a lot after such a sell signal.
  2. There’re 79% chances, this week’s low will be broken the next week.
  3. There’re 43% chances a green week the next week.
  4. If short at the Friday’s close, bears would have 2 out of 14 (14%) chances to be underwater for more than 2 weeks, with max draw down up to 73.35 SPX points. In another word is, 86% chances, at the latest the next next week would close below the Friday’s close.

NYSIWeeklySell

By the way, Dow 5 consecutive red months do not guarantee a green next month, if fact, it has only 6 out of 14 chances, about 43%, see statistics below which is from Schaeffer.

DowLosingStreaks

SEASONALITY: BEARISH MONDAY, BULLISH OCTOBER AND 4TH QUARTER

According Stock Trader’s Almanac, first trading day in October, Dow down 4 of last 5.

The below statistics charts are from Bespoke. Personally, I don’t see much bullish edges for the 4th quarter especially because the index has been down for the year heading into the 4th quarter.

SPXDown10PercentQuarter
Q4Seasonality

The below October seasonality chart is from Bespoke.

OctSeasonality

The below October day to day seasonality chart is from Sentimentrader.

OctSeasonalityDayByDay

SUMMARY OF SIGNALS FOR MY  PUBLIC CHART LIST: 

TREND MOMENTUM COMMENT
Long-term 3 of 3 SELL
Intermediate 5 of 5 SELL 3 of 5 NEUTRAL Cobra Impulse in BUY mode; Non-Stop in SELL mode.
Short-term DOWN 6 of 6 NEUTRAL
  TREND COMMENT
QQQ & Weekly *DOWN  
IWM & Weekly DOWN  
SSEC & Weekly DOWN  
XIU & Weekly DOWN
DAX & Weekly DOWN  
TLT & Weekly UP  
UUP & Weekly UP  
GLD & Weekly DOWN  
USO & Weekly DOWN  
  • * = New update; Blue Text = Link to a chart in my public chart list.
  • UP = Intermediate-term uptrend. Set when weekly buy signal is triggered.
  • DOWN = Intermediate-term downtrend. Set when weekly sell signal is triggered.

Disclaimer

The information contained on this website and from any communication related to the author’s blog and chartbook is for information purposes only. The chart analysis and the market recap do not hold out as providing any financial, legal, investment, or other advice. In addition, no suggestion or advice is offered regarding the nature, profitability, suitability, sustainability of any particular trading practice or investment strategy. The materials on this website do not constitute offer or advice and you should not rely on the information here to make or refrain from making any decision or take or refrain from taking any action. It is up to the visitors to make their own decisions, or to consult with a registered professional financial advisor.

This websites provides third-party websites for your convenience but the author does not endorse, approve, or certify the information on other websites, nor does the author take responsibility for a part or all materials on the third-party websites which are not maintained by the author.