Live Update

Thursday, September 30, 2010

09/30/2010 Market Recap: Watch SPX 1136

  TREND MOMENTUM COMMENT
Long-term 2 of 2 are BUY  
Intermediate 3 of 3 are BUY 5 of 5 are NEUTRAL SPY ST Model in BUY mode; Non-Stop in BUY mode.
Short-term Model is SELL, not confirmed though. 6 of 6 are NEUTRAL The trend is down, not confirmed thought. I hold short position overnight because the mini price target hasn’t met, not because it’s safe to hold overnight.
GANN DAY MOON:SOLAR CYCLE CONCLUSION
10/10-10/11 10/07 : 10/08 Week of 09/24, 09/28 Next pivot date: 09/28 – 10/01, 10/08 – 10/11
BULLISH 09/17 Market Recap: Down 3 weeks then up 3 weeks, the 8th and 9th week is statistically bullish.
0.1.1 SPX Intermediate-term Trading Signals: Head and Shoulders Bottom breakout, target 1242.
09/27 Market Recap: 9 POMO within 20 trading days means huge up in 3 months.
BEARISH 1.0.6 SPY Unfilled Gaps: 18 unfilled gaps, the max was 18.
09/23 Market Recap: AAII is way too bullish.
09/23 Market Recap: SPX 3 consecutive down days means more pullback?
6.1.9a Extreme ISEE Index Readings Watch: ISEE Indices & ETFs Only Index > 100, pullback?
6.5.2b Month Day Seasonality Watch and 6.5.2c Week Seasonality Watch: Bearish this week.
*6.4.3a SPY Bearish Reversal Day Watch: Bearish at least short-term?
09/27 Market Recap: AAPL is now too stretched.
SPY SETUP ENTRY DATE STOP LOSS INSTRUCTION: Mechanic signals, back test is HERE, signals are HERE.
TRADING PLATFORM:
SSO/SDS, UPRO/SPXU
Non-Stop 09/07 L N/A Partial profits on 09/24.
ST Model 09/24 L 1.9*ATR(10)

SHORT-TERM: BEARISH, BUT SPX NEED TO BREAKDOWN BELOW 1136 TO CONFIRM THE DOWNTREND

The bottom line, bulls are not optimistic:

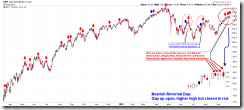
1. SPY formed another Bearish Reversal Bar (Open high, goes higher high but closes in red) today which is the 2nd Bearish Reversal Bar within 4 days and the 4th consecutive reversal like bars.

SPYBearishReversalDay 

2. Could be a typical A = C pattern, in terms both price and trading days. Also it is within the 09/28 to 10/01 time window that seems a logical time for a trend change to happen.

PriceAndTimeAnalysis 

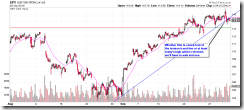
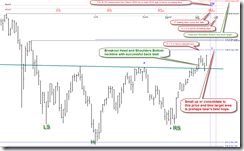
For now, the downtrend has not confirmed yet. Bears still need to push bulls down below SPX 1136 to confirm the short-term downtrend (see 1-2-3 Trend Change pattern at the bottom of the chart below) which if indeed, I expect at least 2 leg down thereafter. The only thing not sure for bears is whether the back test to the broken trend line was enough or the high at 1157 still needs to be tested? We’ll have to see tomorrow. While for bulls, apparently hold above 1136 is absolutely necessary while to resume the bullish uptrend, a decisive breakout above 1157 is needed.

SPX60min 

INTERMEDIATE-TERM: BULLISH, BUT NEED SOME IMAGINATION TO FORESEE HOW BULLISH

See 09/27 Market Recap for more details.

SEASONALITY: LAST TRADING WEEK OF MONTH WAS GENERALLY BEARISH

See 09/24 Market Recap for more details.


HIGHLIGHTS OF THE OTHER ETFS IN MY PUBLIC CHART LIST
TREND COMMENT
QQQQ LA 4.1.1 Nasdaq 100 Index (Weekly): NDX to SPX ratio too high.
IWM UP *Bearish reversal bar, pullback?
CHINA  
EMERGING UP 4.1.6 iShares MSCI Emerging Markets (EEM Weekly): EEM to SPX ratio too high.
*1.4.1 iShares MSCI Emerging Markets (EEM Daily): Black bar, pullback?
CANADA UP TOADV MA(10) too high, pullback?
*Black bar, pullback?
BOND LA 4.2.0 20 Year Treasury Bond Fund iShares (TLT Weekly): Morning Doji Star?
EURO UP *Black bar, pullback?
GOLD UP *Hanging Man?
GDX *LA 4.3.1 Market Vectors Gold Miners (GDX Weekly): GDX to SPX ratio too high.
OIL UP *Breakout, bullish.
ENERGY UP *Black bar, pullback?
FINANCIALS DOWN 4.4.2 Financials Select Sector SPDR (XLF Weekly): Head and Shoulders Top in the forming?
REITS DOWN 4.4.3 Real Estate iShares (IYR Weekly): Home builder is lagging.
MATERIALS DOWN
  1. Please make sure you understand how to use the table above. The purpose of this report is to provide info so contradictory signals are always presented.
  2. Conclusions can be confirmed endlessly, but trading wise, you have to take actions at certain risk level as soon as you feel the confirmation is enough. There’s no way for me to adapt to different risk levels therefore no specific buy/sell signals will be given in this report except the mechanical signals such as SPY ST Model.
  3. * = New update.
  4. Blue Text = Link to a chart in my public chart list.
  5. LA = Lateral Trend.

09/30/2010 After Bell Quick Summary

The bottom line, the short-term trend is down, not confirmed though. I hold partial short overnight since the mini price target has not met, not because it’s safe to hold overnight.

Tomorrow could be a key day because whether it’s a breakdown of a trend line then back test to kiss the trend line goodbye or something else, we’ll have to wait and see. Overall, I’m not optimistic which I’ll blah blah in tonight’s report. For now what I can see the bull’s best hope is the seasonality, because according to the Stock Trader’s Almanac, First trading day in October, NASDAQ up 5 of last 7.

SPY60min

Wednesday, September 29, 2010

09/29/2010 Market Recap: Breakout Wanted ASAP!

  TREND MOMENTUM COMMENT
Long-term 2 of 2 are BUY  
Intermediate 3 of 3 are BUY 5 of 5 are NEUTRAL SPY ST Model in BUY mode; Non-Stop in BUY mode.
Short-term Model is CONFUSED 6 of 6 are NEUTRAL The trend is not clear, I hold partial long overnight because the mini price target hasn’t met, not because it’s safe to hold overnight.
GANN DAY MOON:SOLAR CYCLE CONCLUSION
10/10-10/11 10/07 : 10/08 Week of 09/24, 09/28 Next pivot date: 09/28 – 10/01, 10/08 – 10/11
BULLISH 09/17 Market Recap: Down 3 weeks then up 3 weeks, the 8th and 9th week is statistically bullish.
0.1.1 SPX Intermediate-term Trading Signals: Head and Shoulders Bottom breakout, target 1242.
09/27 Market Recap: 9 POMO within 20 trading days means huge up in 3 months.
BEARISH 1.0.6 SPY Unfilled Gaps: 18 unfilled gaps, the max was 18.
09/23 Market Recap: AAII is way too bullish.
09/23 Market Recap: SPX 3 consecutive down days means more pullback?
6.1.9a Extreme ISEE Index Readings Watch: ISEE Indices & ETFs Only Index > 100, pullback?
6.5.2b Month Day Seasonality Watch and 6.5.2c Week Seasonality Watch: Bearish this week.
6.4.3a SPY Bearish Reversal Day Watch: Bearish at least short-term?
09/27 Market Recap: AAPL is now too stretched.
SPY SETUP ENTRY DATE STOP LOSS INSTRUCTION: Mechanic signals, back test is HERE, signals are HERE.
TRADING PLATFORM:
SSO/SDS, UPRO/SPXU
Non-Stop 09/07 L N/A Partial profits on 09/24.
ST Model 09/24 L 1.9*ATR(10)

SHORT-TERM: BULLS NEED A BREAKOUT, THE LONGER THE CONSOLIDATION THE WORSE THE CHANCES

Short-term direction still depends on which side breaks first, SPX 1148 or 1122? See 09/27 Market Recap for more details. However, as exclaimed by the title, bulls need a breakout as soon as possible because the longer the current consolidation goes the worse the situation for bulls. As illustrated in the chart below, since March 2009, a consolidation usually meant a top and on average it took 5 days to consolidate before a big pullback kicking in, while now the market has already been consolidating for 3 days. In another word, all bears need are to hold the current consolidation range for 2 to 3 more days then probably the gravidity would come to rescue.

Consolidation 

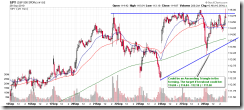
1.0.1 S&P 500 SPDRs (SPY 15 min), the Ascending Triangle is confirmed today, now we will see if bulls can make a breakout tomorrow. Remember, the breakout must be huge, otherwise it still could be seen as a consolidation which according to the chart above, is not bull friendly. The question is: Is huge up possible? I recommend to take a look at today’s After Bell Quick Summary, because a potential Firework trading setup could be triggered and if so then bulls may have good chances.

SPY15min 

INTERMEDIATE-TERM: BULLISH, BUT NEED SOME IMAGINATION TO FORESEE HOW BULLISH

See 09/27 Market Recap for more details.

SEASONALITY: LAST TRADING WEEK OF MONTH WAS GENERALLY BEARISH

See 09/24 Market Recap for more details.


HIGHLIGHTS OF THE OTHER ETFS IN MY PUBLIC CHART LIST
TREND COMMENT
QQQQ LA 4.1.1 Nasdaq 100 Index (Weekly): NDX to SPX ratio too high.
IWM UP
CHINA  
EMERGING UP 4.1.6 iShares MSCI Emerging Markets (EEM Weekly): EEM to SPX ratio too high.
CANADA UP TOADV MA(10) too high, pullback?
BOND *LA 4.2.0 20 Year Treasury Bond Fund iShares (TLT Weekly): Morning Doji Star?
EURO UP
GOLD UP
GDX UP 4.3.1 Market Vectors Gold Miners (GDX Weekly): GDX to SPX ratio too high.
OIL *UP
ENERGY UP
FINANCIALS *DOWN 4.4.2 Financials Select Sector SPDR (XLF Weekly): Head and Shoulders Top in the forming?
REITS *DOWN 4.4.3 Real Estate iShares (IYR Weekly): Home builder is lagging.
MATERIALS *DOWN
  1. Please make sure you understand how to use the table above. The purpose of this report is to provide info so contradictory signals are always presented.
  2. Conclusions can be confirmed endlessly, but trading wise, you have to take actions at certain risk level as soon as you feel the confirmation is enough. There’s no way for me to adapt to different risk levels therefore no specific buy/sell signals will be given in this report except the mechanical signals such as SPY ST Model.
  3. * = New update.
  4. Blue Text = Link to a chart in my public chart list.
  5. LA = Lateral Trend.

09/29/2010 After Bell Quick Summary

The bottom line, the short-term trend is not clear, I hold partial long position overnight simply because the mini target has not met not because it’s safe to hold overnight. By the way, the position I reported here is for my short-term model only because it’s not practical (for now) to give intraday signals. It’s by no means my total positions (yes, I may or may not have other positions). And to (pretend to) act NEUTRAL, I’m not supposed to report any of my positions except those mechanical trading signals such as SPY ST Model.

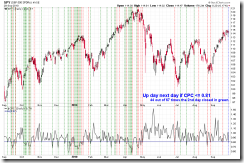
One trick for tomorrow, when CPC <= 0.81, 44 out of 67 times (66%) a green day the next day.

1

Those who know the Firework setup can click the Firework link to read a little about its history as it might be triggered today. I for myself still need to observe awhile to make sure it still works. The most recent 3 times a possible Firework setup was triggered was mentioned on:

  1. 06/28 After Bell Quick Summary, the setup failed thereafter.
  2. 07/19 After Bell Quick Summary, the setup was great.
  3. 08/23 After Bell Quick Summary, well, I don’t know if you want to count it as successful or not.

Tuesday, September 28, 2010

09/28/2010 Market Recap: Ascending Triangle?

  TREND MOMENTUM COMMENT
Long-term 2 of 2 are BUY  
Intermediate 3 of 3 are BUY 5 of 5 are NEUTRAL SPY ST Model in BUY mode; Non-Stop in BUY mode.
Short-term Model is BUY 6 of 6 are NEUTRAL The trend is up but I hold no long position overnight.
GANN DAY MOON:SOLAR CYCLE CONCLUSION
10/10-10/11 10/07 : 10/08 Week of 09/24, 09/28 Next pivot date: 09/28 – 10/01, 10/08 – 10/11
BULLISH 09/17 Market Recap: Down 3 weeks then up 3 weeks, the 8th and 9th week is statistically bullish.
0.1.1 SPX Intermediate-term Trading Signals: Head and Shoulders Bottom breakout, target 1242.
09/27 Market Recap: 9 POMO within 20 trading days means huge up in 3 months.
BEARISH 1.0.6 SPY Unfilled Gaps: 18 unfilled gaps, the max was 18.
09/23 Market Recap: AAII is way too bullish.
09/23 Market Recap: SPX 3 consecutive down days means more pullback?
6.1.9a Extreme ISEE Index Readings Watch: ISEE Indices & ETFs Only Index > 100, pullback?
6.5.2b Month Day Seasonality Watch and 6.5.2c Week Seasonality Watch: Bearish this week.
6.4.3a SPY Bearish Reversal Day Watch: Bearish at least short-term?
09/27 Market Recap: AAPL is now too stretched.
SPY SETUP ENTRY DATE STOP LOSS INSTRUCTION: Mechanic signals, back test is HERE, signals are HERE.
TRADING PLATFORM:
SSO/SDS, UPRO/SPXU
Non-Stop 09/07 L N/A Partial profits on 09/24.
ST Model 09/24 L 1.9*ATR(10)

SHORT-TERM: BULLS ON OFFENSE BUT BEARS MAY STILL HAVE CHANCES

Short-term direction still depends on which side breaks first, SPX 1148 or 1122. See 09/27 Market Recap for more details. For now bulls are on offense as an Ascending Triangle could be formed. If breakout and up HUGE tomorrow, then bears will have to retreat to the next consolidation area before any potential counterstrikes could be seriously considered.

SPY15min 

Of course, bears still have chances, except that according to 6.5.2b Month Day Seasonality Watch, short at today’s close cover before 09/30 close, the odds were 12 out of 13, there’re 2 charts in favor of bears:

VIX Leads SPX. The divergence is a little bit large so the signal might worth some points.

VIXLeadsSPX 

CPCI is a little too high, although not extremely high, but still can see some bearish edges on the chart.

CPCIWatch 

A reader asked again about what happened when both VIX and SPX closed in green. Well, see chart below, just a little little little little bearish biased toward tomorrow.

SPXandVIXDivergenceWatch 

INTERMEDIATE-TERM: BULLISH, BUT NEED SOME IMAGINATION TO FORESEE HOW BULLISH

See 09/27 Market Recap for more details.

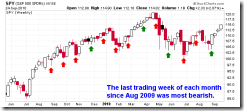
SEASONALITY: LAST TRADING WEEK OF MONTH WAS GENERALLY BEARISH

See 09/24 Market Recap for more details.


HIGHLIGHTS OF THE OTHER ETFS IN MY PUBLIC CHART LIST
TREND COMMENT
QQQQ LA 4.1.1 Nasdaq 100 Index (Weekly): NDX to SPX ratio too high.
IWM UP
CHINA  
EMERGING UP 4.1.6 iShares MSCI Emerging Markets (EEM Weekly): EEM to SPX ratio too high.
CANADA *UP TOADV MA(10) too high, pullback?
BOND UP 4.2.0 20 Year Treasury Bond Fund iShares (TLT Weekly): Morning Doji Star?
EURO UP
GOLD UP 2 black Bar in a row, pullback?
GDX *UP 4.3.1 Market Vectors Gold Miners (GDX Weekly): GDX to SPX ratio too high.
OIL *LA Bearish reversal bar, pullback?
ENERGY *UP Bearish reversal bar plus Hanging Man?
FINANCIALS *LA 4.4.2 Financials Select Sector SPDR (XLF Weekly): Head and Shoulders Top in the forming?
3.4.0 Financials Select Sector SPDR (XLF Daily): Bearish reversal bar?
REITS *LA 4.4.3 Real Estate iShares (IYR Weekly): Home builder is lagging.
3.4.1 Real Estate iShares (IYR Daily): Bearish reversal bar?
MATERIALS LA Bearish reversal bar?
  1. Please make sure you understand how to use the table above. The purpose of this report is to provide info so contradictory signals are always presented.
  2. Conclusions can be confirmed endlessly, but trading wise, you have to take actions at certain risk level as soon as you feel the confirmation is enough. There’s no way for me to adapt to different risk levels therefore no specific buy/sell signals will be given in this report except the mechanical signals such as SPY ST Model.
  3. * = New update.
  4. Blue Text = Link to a chart in my public chart list.
  5. LA = Lateral Trend.
09/28/2010 After Bell Quick Summary

The bottom line, the short-term trend is up but I hold no long position overnight.

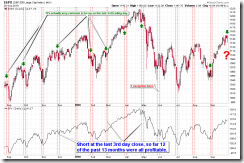
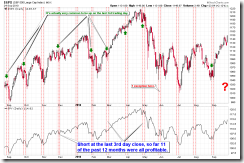
I wonder if you still remember the setup for the last 2 trading days of each month since August 2009? Today actually should be an up day, so no surprise. Now let’s see if the rest part plays out: Sell short at today’s close and cover before 09/30 close, your odds of winning something WERE 12 out of 13.

1

Monday, September 27, 2010

09/27/2010 Market Recap: Watch SPX 1148 and 1122

  TREND MOMENTUM COMMENT
Long-term 2 of 2 are BUY  
Intermediate 3 of 3 are BUY 5 of 5 are NEUTRAL SPY ST Model in BUY mode; Non-Stop in BUY mode.
Short-term Model is BUY 6 of 6 are NEUTRAL The trend is up but I hold no long position overnight.
GANN DAY MOON/SOLAR CYCLE CONCLUSION
9/23,10/10-10/11 09/23 / 09/23 Week of 09/24, 09/28 Next pivot date: 09/21 – 09/23, 09/28 – 10/01
BULLISH 09/17 Market Recap: Down 3 weeks then up 3 weeks, the 8th and 9th week is statistically bullish.
0.1.1 SPX Intermediate-term Trading Signals: Head and Shoulders Bottom breakout, target 1242.
BEARISH 1.0.6 SPY Unfilled Gaps: 18 unfilled gaps, the max was 18.
09/23 Market Recap: AAII is way too bullish.
09/23 Market Recap: SPX 3 consecutive down days means more pullback?
6.1.9a Extreme ISEE Index Readings Watch: ISEE Indices & ETFs Only Index > 100, pullback?
6.5.2b Month Day Seasonality Watch and 6.5.2c Week Seasonality Watch: Bearish next week.
*6.4.3a SPY Bearish Reversal Day Watch: Bearish at least short-term?
SPY SETUP ENTRY DATE STOP LOSS INSTRUCTION: Mechanic signals, back test is HERE, signals are HERE.
TRADING PLATFORM:
SSO/SDS, UPRO/SPXU
Non-Stop 09/07 L N/A Partial profits on 09/24.
ST Model 09/24 L 1.9*ATR(10)

SHORT-TERM: WATCH SPX 1148 and 1122

Nothing to say today, the short-term direction is not clear, need see which one gets broken first, SPX 1148 or 1122?

  1. Decisively close above 1148 then bullish. But how bullish will need some imagination, see intermediate-term session below.
  2. Decisively close below 1122, then could be Double Top or 1-2-3 Trend Change pattern which is a typical short setup.

SPY60min 

INTERMEDIATE-TERM: BULLISH, BUT NEED SOME IMAGINATION TO FORESEE HOW BULLISH

There’s no doubt that the intermediate-term is bullish, see 09/17 Market Recap and 09/24 Market Recap for back test results. However, as for how bullish, some imaginations are needed (and frankly, I don’t have such kind of ability). Because although the statistics about POMO below almost guarantees the market will be up huge in 3 months, but on the other hand, AAPL which now weights more than 20% in Nasdaq 100 index, is way too stretched that wasn’t pleasant for the overall market in the past. The question is: Will AAPL stretch even more this time? Or could the market be up huge without AAPL?

Take a look at the statistics about POMO first:

According to Permanent Open Market Operations (POMO) from Trading the Odds, since we’ve had more than 9 POMO within the last 20 trading days so the market should be up huge (more than 10%) in the next 3 months. The chart below is copied from Trading the Odds for completeness purpose.

POMO 

Now take a look at what happened whenever AAPL was so stretched:

AAPLTooStretched 

SEASONALITY: LAST TRADING WEEK OF MONTH WAS GENERALLY BEARISH

See 09/24 Market Recap for more details.


HIGHLIGHTS OF THE OTHER ETFS IN MY PUBLIC CHART LIST
TREND COMMENT
QQQQ *LA 4.1.1 Nasdaq 100 Index (Weekly): NDX to SPX ratio too high.
IWM UP Morning Star?
CHINA  
EMERGING UP 4.1.6 iShares MSCI Emerging Markets (EEM Weekly): EEM to SPX ratio too high.
CANADA *LA TOADV MA(10) too high, pullback?
BOND *UP 4.2.0 20 Year Treasury Bond Fund iShares (TLT Weekly): Morning Doji Star?
EURO UP
GOLD UP *2 black Bar in a row, pullback?
GDX *DOWN 4.3.1 Market Vectors Gold Miners (GDX Weekly): GDX to SPX ratio too high.
OIL UP *Bearish reversal bar, pullback?
ENERGY *LA *Bearish reversal bar?
FINANCIALS *DOWN 4.4.2 Financials Select Sector SPDR (XLF Weekly): Head and Shoulders Top in the forming?
*3.4.0 Financials Select Sector SPDR (XLF Daily): Bearish reversal bar?
REITS *DOWN 4.4.3 Real Estate iShares (IYR Weekly): Home builder is lagging.
*3.4.1 Real Estate iShares (IYR Daily): Bearish reversal bar?
MATERIALS *LA *Bearish reversal bar?
  1. Please make sure you understand how to use the table above. The purpose of this report is to provide info so contradictory signals are always presented.
  2. Conclusions can be confirmed endlessly, but trading wise, you have to take actions at certain risk level as soon as you feel the confirmation is enough. There’s no way for me to adapt to different risk levels therefore no specific buy/sell signals will be given in this report except the mechanical signals such as SPY ST Model.
  3. * = New update.
  4. Blue Text = Link to a chart in my public chart list.
  5. LA = Lateral Trend.
Disclaimer

The information contained on this website and from any communication related to the author’s blog and chartbook is for information purposes only. The chart analysis and the market recap do not hold out as providing any financial, legal, investment, or other advice. In addition, no suggestion or advice is offered regarding the nature, profitability, suitability, sustainability of any particular trading practice or investment strategy. The materials on this website do not constitute offer or advice and you should not rely on the information here to make or refrain from making any decision or take or refrain from taking any action. It is up to the visitors to make their own decisions, or to consult with a registered professional financial advisor.

This websites provides third-party websites for your convenience but the author does not endorse, approve, or certify the information on other websites, nor does the author take responsibility for a part or all materials on the third-party websites which are not maintained by the author.