Live Update

Friday, October 30, 2009

10/30/2009 After Bell Quick Summary

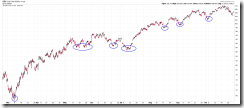
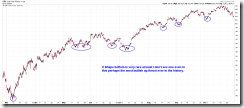
OK, I said yesterday, a V shape bottom is rare. So what the chances are that we get another V shape reversal the next Monday? And even we got that, what the chances are that it’s a bottom (since it’s a sharp V shape again)? Also think about this: The Monday’s reversal, if any, reverses the Friday’s reversal which reversed the Thursday’s reversal. Again what are the chances? You might laugh me at the Monday’s close, but surely I won’t bet against odds, after all, to trade is to win in the long run, so the key is always betting on the higher odds.

SPYBottomShape

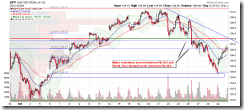
The bottom line, I don’t see any meaningful bottom pattern yet so it’s logic to expect that the Oct 2 lows will be tested next week.

SPY30min

Enjoy your weekend! Oh, anyone followed my VIX ENV setup? Hope you read the trend table about the pre-condition which is “Close > Open” and which apparently we didn’t get, so no setup at all, right?

PS. I just got a question asking “Close > Open”. I mean SPY Close > Open not VIX Close > Open.

Thursday, October 29, 2009

10/29/2009 Market Recap: Real test tomorrow

Summary:

CPCE trend line borken, so the pullback could be over.

Bears hope is the multiple resistances above while bulls may get the the next 10 days bullish cycle.

VIX ENV buy setup is triggered.

  TREND MOMENTUM EMOTION COMMENT - Sample for using the trend table.
Long-term Up   Disbelieve  
Intermediate Down Neutral  
Short-term Down *Neutral    
SPY SETUP ENTRY DATE INSTRUCTION STOP LOSS Mechanic trading signals for reference only.
Back tested since 2002.
ST Model   Stopped out with loss on 10/26
Reversal Bar     Stopped out with gain on 10/21.
NYMO Sell 10/21 S Break even

Hey, I'm merely a machine. I don't know how to take partial profit but as a human being, you should smart enough to know when to take partial profit, right?

VIX ENV   Long tomorrow if Close > Open.  


INTERMEDIATE-TERM: CPCE DIDN'T HOLD THE TREND LINE

2.8.0 SPX:CPCE, trend line broken, this probably means that the pullback was over.

CPCE 

SHORT-TERM: BEARS HOPE IS THE MULTIPLE RESISTANCES ABOVE

The bottom line, as mentioned in the After Bell Quick Summary – a real test could be in tomorrow. The huge rally today was not totally unexpected as you may not notice the chart I posted yesterday. I reposted here again. Whenever the same signals were extremely oversold, the next day was up big. Today we got exactly the same. So does this mean a big Doji tomorrow?

SPXVIXNYMO

0.0.2 SPY Short-term Trading Signals, this is the bear’s hope, multiple resistances ahead and the action today could be seen as a breakdown then back test of the broken area.

SPYShortTerm

0.0.3 SPX Intermediate-term Trading Signals, this is the bull’s hope, the 10 days down cycle is over and most likely the next 10 days will be an up cycle. Besides, seasonality favors bull too. Quote from www.sentimentrader.com:

The five-day window covering the last two days of October through the first three of November has been positive 72% of the time since 1928, averaging +1.2%.  Over the past 30 years, it was 80% positive with a return that averaged +1.9%.  Notably, the average drawdown (worst loss at any point during the five days) was -0.7% while the maximum gain averaged +3.1%.

SPXMidTerm

6.2.0a VIX Trading Signals (ENV), VIX buy setup triggered. The setup is not bad according to the back test summary posted below. Just there’s an additional condition, please find it in the trend table above.

VIXENVBuy VIXBackTest

INTERESTING CHARTS: NONE

10/29/2009 After Bell Quick Summary

Three points for your attention:

1. Seldom a V shape bottom like today. Check SPY 60 min chart since the March, I don’t see any sharper reversal than that of today.

SPYBottomShape

2. The real test is tomorrow.

SPY30min

3. SPY has fully recovered the yesterday’s loss, yes, but neither QQQQ nor IWM.

SPYQQQQIWM

The conclusion is: you might not need to blame yourself for not buying this dip. It’s now too early to say that the bottom is in.

By the way, I know some people will say there’s no volume today. Well, the market has been rallying for months with shrinking volume, who cares the volume anyway, the market has the bless of the Fed’s printing machine.

The relieve rally may have started

I think the relieve rally may have started. The chart below looks like a typical Base and Breakout Trading Setup: WRB followed by 2 inside bars then a breakout. It’s essential to see that breakout holds though.

ES 12-09  10_29_2009 (30 Min)

Wednesday, October 28, 2009

10/28/2009 Market Recap: Market Oversold

Summary:

"Pair" indices led the breakdown which is bearish for intermediate-term.

Short-term is very oversold, expect a rebound soon.

  TREND MOMENTUM EMOTION COMMENT - Sample for using the trend table.
Long-term Up   Disbelieve  
Intermediate Down Neutral  
Short-term Down *Oversold    
SPY SETUP ENTRY DATE INSTRUCTION STOP LOSS Mechanic trading signals for reference only.
Back tested since 2002.
ST Model   Stopped out with loss on 10/26
Reversal Bar     Stopped out with gain on 10/21.
NYMO Sell 10/21 S Break even

Hey, I'm merely a machine. I don't know how to take partial profit but as a human being, you should smart enough to know when to take partial profit, right?


INTERMEDIATE-TERM: "PAIR" INDICES LED THE BREAKDOWN

Take a look at the chart below, a few leading indices led the breakdown. I consider them as intermediate-term bearish and expect SPY and QQQQ to follow soon.

PairWatch

2.8.0 SPX:CPCE, trend line still held. No need to explain more about this chart, do I?

CPCE

SHORT-TERM: VERY OVERSOLD

I won’t put many charts here today as the oversold signals are everywhere. The question is when there’ll be a rebound and if this is a buyable dip. I don’t know when there’ll be a rebound, could be tomorrow the earliest. As for whether to buy this dip, personally without any short position as insurer, I won’t buy this dip.

The following chart shows 2 oversold signals I think worth of watching. For other so so oversold signals, no bother to mention here. Take a look at 0.0.2 SPY Short-term Trading Signals, if you have time, all indicators are oversold now. By the way, I’ve noticed that still some readers are unaware that all the charts I mention here are in my public list at www.stockcharts.com. It’s a very good collection of indicators worth of watching by yourself even most of them I do not mention everyday.

SPY VIX NYMO Watch

1.1.4 Nasdaq 100 Index Intermediate-term Trading Signals, this chart also needs your attention. Look at NADNV (Nasdaq Down Volume), as it usually means a bottom!

NDXMidTerm

INTERESTING CHARTS:

3.4.2 United States Oil Fund, LP (USO 30 min), could be a Head and Shoulders Top.

USO30min

10/28/2009 After Bell Quick Summary

The bottom line, I don’t see any reversal patterns so could be more downside ahead. The bull’s hope is a reversal day tomorrow because now the market is very oversold with 1765 Russell 3000 stocks fell on increased volume, so one more down day, perhaps a sharp gap down tomorrow, may cause bulls to throw in the towel thus creating a capitulation effect usually needed for a bottom. On the other hand, if we don’t get any sharp down, instead a small green day tomorrow, then be careful, the sell off might not be over yet. Anyway, my suggestion is still that do not buy this dip before seeing a reversal pattern. I’ll post something here in my blog as soon as I see a reversal pattern.

SPY30min

One trick today: Days after a Major Distribution Day (NYDNV/NYUPV > 9), such as today tended to close in green 21 out of 32 times (66%).

MDDWatch

Tuesday, October 27, 2009

10/27/2009 Market Recap: Three Black Crows

Summary:

CPCE held for 2 days confirming at least a short-term top.

Could be more pullbacks ahead but the market may rebound first.

  TREND MOMENTUM EMOTION COMMENT - Sample for using the trend table.
Long-term Up   Disbelieve  
Intermediate Down Neutral  
Short-term Down *A little oversold    
SPY SETUP ENTRY DATE INSTRUCTION STOP LOSS Mechanic trading signals for reference only.
Back tested since 2002.
ST Model 10/14 L 10/13 Low Stopped out with loss on 10/26
Reversal Bar     Stopped out with gain on 10/21.
NYMO Sell 10/21 S *Adjust stop loss *Break even


INTERMEDIATE-TERM: CPCE HELD FOR 2 DAYS CONFIRMING AT LEAST A SHORT-TERM TOP

2.8.0 SPX:CPCE, trend line held for 2 days confirming at least a short-term top. Let’s see how long the trend line will hold this time.

CPCE 

SHORT-TERM: COULD BE MORE PULLBACKS AHEAD BUT THE MARKET MAY REBOUND FIRST

0.0.2 SPY Short-term Trading Signals, Three Black Crows formed, so very likely more pullback ahead. The good news is that NYMO is now oversold so could be a rebound soon. Just if you really really want to buy this dip, better wait for a Bullish Reversal Day (Open low close higher) or a reversal pattern on an intraday chart. Right now I see neither of them.

SPYShortTerm

T2103 Zweig Breadth Thrust from Telechart, oversold so it also argues for a rebound.

T2103

1.0.9 SPX Cycle Watch (60 min), a cycle is due today looks like a cycle bottom so again it argues for a rebound.

SPX60minCycle

INTERESTING CHARTS:

1.4.0 Shanghai Stock Exchange Composite Index (Daily), Evening Star so could mean more pullbacks ahead.

SSECDaily

10/27/2009 After Bell Quick Summary

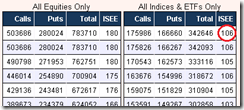
I have one trick today: ISEE Indices & ETFs Only Index > 100, 25 out of 30 (83%) times a red close either tomorrow (most likely, see red arrows) or the day after tomorrow (see blue arrows).

ISEE ISEEWatch

The bottom line, still could be a little more on the downside because it looks like a Descending Triangle (or Pennant) is in the forming.

SPY30min

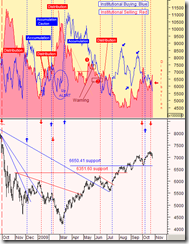
Institutional Buying and Selling Trending

Courtesy of www.stocktiming.com:

On October 1st, Institutional Investors had their first day of Distribution since July 15th.  On Friday, October 9th, they were back into Accumulation. Yesterday, Institutions went deeper into Distribution.  Institutional buying  decreased, and selling increased. Do NOT try to go "against" the Institutions when they are in Distribution. Do note that the Institutional Selling is still in a up trend (higher/highs and higher/lows).

3

Monday, October 26, 2009

10/26/2009 Market Recap: VIX Surge

Summary:

CPCE argues for an intermediate-term top again, need hold the trend line to confirm through.

Bears may need to take profits if further drop tomorrow.

  TREND MOMENTUM EMOTION COMMENT - Sample for using the trend table.
Long-term Up   Disbelieve  
Intermediate *Down Neutral  
Short-term Down Neutral    
SPY SETUP ENTRY DATE INSTRUCTION STOP LOSS Mechanic trading signals for reference only.
Back tested since 2002.
ST Model 10/14 L 10/13 Low *Stopped out with loss on 10/26
Reversal Bar     Stopped out with gain on 10/21.
NYMO Sell 10/21 S 10/21 High

Improved setup, now the winning rate is 66% and the Gain/Loss Ratio is 4.5. Click the link to see more details.


INTERMEDIATE-TERM: WATCH CPCE TOP SIGNAL

2.8.0 SPX:CPCE, argues for an intermediate-term top again. The trend line must be held in order to confirm indeed this is an intermediate-term top.

CPCE

SHORT-TERM: BEARS MAY NEED TO TAKE PROFIT IF FURTHER DROP TOMORROW

The bottom line, the market may rebound tomorrow. If however, it keeps dropping, bears better take some chips out of the table.

0.0.2 SPY Short-term Trading Signals, both NYMO and NYADV are very close to oversold. Pay attention to the dashed green lines, SPY rebounded as soon as either of these 2 indicators are oversold.

SPYShortTerm

2.0.0 Volatility Index (Daily), looks like whenever VIX surged high the pullback was almost over. Will this time the same again? Also posted below the visual effect chart – SPY bars are green highlighted whenever VIX up more than 9% a day. So again if the market keeps dropping tomorrow, bears better take some profits.

VIXDaily VIXSurgeVisualTest

1.0.4 S&P 500 SPDRs (SPY 15 min), a few positive divergences, so it’s also possible we’ll see a rebound tomorrow morning.

SPY15min

INTERESTING CHARTS: NONE

10/26/2009 After Bell Quick Summary

OK, we didn’t get 1-2-3 formation breakdown, instead it was a Symmetrical Triangle breakdown, but the target is almost the same. Also a continuation pattern (possibly a Bear Flag) seems in the forming which if breakdown the max target could be around 104.70 which is right at the Oct 6 gap support. The bottom line, short-term is down and I suspect that there’ll be more pullback ahead.

SPY30min

Sunday, October 25, 2009

10/23/2009 Market Recap: Bearish Engulfing and Stick Sandwich

Summary:

Major intermediate trading signals are on the sell, but I'll give it another day.

Bearish Engulfing and Stick Sandwich pattern on SPY daily chart looks bearish.

A quick look at my version of "Buying Climaxes" chart.

  TREND MOMENTUM EMOTION COMMENT - Sample for using the trend table.
Long-term Up   Disbelieve  
Intermediate Up Neutral No argue NYSI not confirming the up trend.
Short-term *Down Neutral    
SPY SETUP ENTRY DATE INSTRUCTION STOP LOSS Mechanic trading signals for reference only.
Back tested since 2002.
ST Model 10/14 L *Adjust Stop Loss *10/13 Low
Reversal Bar   Stopped out with gain on 10/21.
NYMO Sell 10/21 S 10/21 High

*Improved setup, now the winning rate is 66% and the Gain/Loss Ratio is 4.5. Click the link to see more details.


INTERMEDIATE-TERM: SOME SELL SIGNALS BUT I'LL WAIT FOR ANOTHER DAY

0.0.3 SPX Intermediate-term Trading Signals, sell yelled by MACD and NYSI plus lots of negative divergences, not good. But I’ll wait until Monday before downgrading the intermediate-term to down from up.

SPXMidTerm

The bottom line: 1.2.1 Dow Theory: Averages Must Confirm, breadth extremely overbought and TRAN not confirming INDU's new high. I expect at least 10% correction.

DowTheory

SHORT-TERM: BEARISH ENGULFING AND STICK SANDWICH FORMED ON THE SPY DAILY CHART

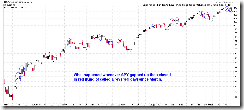
We had yet another reversal day on Friday (Open high but close in red. Yeah, yeah, I know how a “Key Reversal” day is defined, this just is my way of a reversal day. And by the way, statistically, a “Key Reversal” day actually doesn’t mean a reversal…). The chart below shows all the similar reversal days since March: The chances are good that SPY will consolidate then pullback. Therefore the short-term either we may see a few days consolidation or the consolidation was over, the pullback starts next week.
SPYReversalDayWatch 

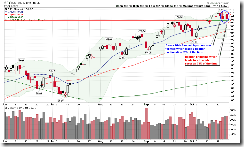
0.0.2 SPY Short-term Trading Signals, Bearish Engulfing and Stick Sandwich, looks bearish. As mentioned in the After Bell Quick Summary, the green line below is very important. See chart 1.0.3 S&P 500 SPDRs (SPY 30 min), if broken then a 1-2-3 formation will be formed with target at 105ish。Of course, bulls have their chances:  a Symmetrical Triangle is in the forming. Anyway, I mean it’s too early to call who’s going to win now, let’s wait and see.
SPYShortTerm SPY30min

Take a look at the chart below: too many stocks in SPX reached Buying Climaxes this week (see red bars), not so good. By the way, this indicator is part of the Investors Intelligence paid services, I made it by myself according its definition and I’ll watch it from now on. Hopefully it could save you a few bucks.

ClimaxWatch

Buying & Selling Climaxes

Investors Intelligence uses this term to describe a more specific event which occurs over a one week period.

  • A buying climax is where a stock makes a new 52 week high but then closes below the previous week’s close.
  • A selling climax is where a stock makes a new 52 week low and then closes above the previous week’s close.

The reason that we use such a rigid definition for climaxes is that this enables us to classify accurately and consistently what is and what isn’t a climax. This is important as we maintain historic records of the climaxes generated each week and have noted that important market turning points are often accompanied by a sudden rise in the number of buying or selling climaxes.

A great example of this was in October 2002 when the Dow Industrials made its final low. At this point, our US Market Timing Service observed a massive increase in the number of US stocks generating selling climaxes. By communicating this to subscribers, we were able to provide a good early indication that a bounce was on the cards.

 INTERESTING CHARTS:

 3.3.0 streetTRACKS Gold Trust Shares (GLD Daily), Ascending Triangle, so gold could rise further, May not be on Monday though.

GLDDaily

3.4.2 United States Oil Fund, LP (USO 30 min), Descending Triangle, could be a short-term pullback.

USO30min

Friday, October 23, 2009

10/23/2009 After Bell Quick Summary

OK, reversal of the previous reversal of the previous reversal, this is exactly what I talked in yesterday’s After Bell Quick Summary. Beware of a potential trend change.

In case you’re too bullish or too bearish, let’s take a quick look at the ES (SPX mini futures). The thick blue line is the major support I’ve been watching. And apparently bulls and bears are fighting alone the line making a bloody battle field bounded by lines a little above and a little below which I call black hole that sucks everything nearby. Until this hole is cleared the direction is still unknown. So let’s wait for the next Monday. The bottom line, I still believe there’ll be a further pullback, just I don’t know if we’ll see yet another reversal that reverses today’s reversal of the previous reversal of the previous reversal. Enjoy your weekend!

ES 12-09  10_23_2009 (60 Min)

Thursday, October 22, 2009

10/22/2009 Market Recap: Bullish Engulfing

Summary:

Still possible the market will consolidate then pullback.

Reversal Bar setup will be triggered if we get an up day tomorrow.

  TREND MOMENTUM EMOTION COMMENT - Sample for using the trend table.
Long-term Up   Disbelieve  
Intermediate Up Neutral No argue NYSI not confirming the up trend.
Short-term Up Neutral    
SPY SETUP ENTRY DATE INSTRUCTION STOP LOSS Mechanic trading signals for reference only.
Back tested since 2002.
ST Model 10/14 L *Adjust Stop Loss *10/09 Low
Reversal Bar   *Confirmed buy if up day tomorrow.
NYMO Sell 10/21 S 10/21 High

Winning Rate: 59%, Gain/Loss Ratio: 4.9

Very risky trade but occasionally may catch the exact market top.


INTERMEDIATE-TERM: NO UPDATE

SHORT-TERM: STILL POSSIBLE THE MARKET WILL CONSOLIDATE THEN PULLBACK

The bottom line, 1.1.3 QQQQ Short-term Trading Signals, I still think the market will consolidate then pullback. In other words, I believe the QQQQ may repeat the Aug case marked by the blue cycle.

QQQQShortTerm

3.1.0 PowerShares DB US Dollar Index Bullish Fund (UUP Daily), this is the main reason I still believe a pullback: ChiOsc is way too low. The previous 2 times when it was this low, US$ rebounded (See dashed green lines). Besides, 3.1.1 PowerShares DB US Dollar Index Bullish Fund (UUP Weekly), the huge 2008 consolidation area should provide enough support for UUP.

UUPDaily UUPWeekly

0.0.2 SPY Short-term Trading Signals, Bullish Engulfing, therefore if SPY goes up again tomorrow the Reversal Bar trading setup will be triggered. However since there’s not much profit for ST Model yet, which make the current long position easily go under water again, so personally I won’t follow this setup to add any long. The trend table about this trade will be updated as usual though.

SPYShortTerm

INTERESTING CHARTS: NONE

10/22/2009 After Bell Quick Summary

Bears might feel like being teased again, right? Well, not exactly. If I remember correctly every time a trend is about to end there always some days like today and yesterday: Sudden violent rise or drop which looks very like that the trend is being reversed but the next day, the market reverses completely the previous day’s “reversal” and the next next day it may look like things go back to normal again – yeah, told you so, this bull/bear will go much much higher/lower. Well, be careful, don’t be too bullish here.

I don’t see any trick today. A puzzle was solved though: The SPX 60min Cycle due today looks like a bottom, I mentioned in the last night report.

SPX60minCycle

Wednesday, October 21, 2009

10/21/2009 Market Recap: Follow-through Needed

Summary:

A follow-through is needed to confirm the short-term pullback.

  TREND MOMENTUM EMOTION COMMENT - Sample for using the trend table.
Long-term Up   Disbelieve  
Intermediate Up Neutral No argue NYSI not confirming the up trend.
Short-term Up Neutral    
SPY SETUP ENTRY DATE INSTRUCTION STOP LOSS Mechanic trading signals for reference only.
Back tested since 2002.
ST Model 10/14 L *Adjust Stop Loss *10/08 Low
Reversal Bar 10/05 L 10/16 Low *Stopped out with gain.
VIX ENV 10/06 L 10/19 Low

*Stopped out with gain.

NYMO Sell 10/21 S *Short intraday *10/21 High

Winning Rate: 59%, Gain/Loss Ratio: 4.9

Very risky trade but occasionally may catch the exact market top.


INTERMEDIATE-TERM: NO UPDATE

SHORT-TERM: A FOLLOW THROUGH IS NEEDED TO CONFIRM A SHORT-TERM PULLBACK

The bottom line, the sharp sell off before close may mean nothing if we don’t see a follow-through tomorrow. 1.0.3 S&P 500 SPDRs (SPY 30 min), 1.1.5 PowerShares QQQ Trust (QQQQ 30 min), both stopped right at an important support and have met the minimum Fib 23.6 retracement target, so there’re possibilities that the pullback was over.

 SPY30min

1.1.3 QQQQ Short-term Trading Signals, overall, I still expect more pullbacks, especially it doesn’t look like the QQQQ black bar’s prophecy has been realized. Just I’m not sure whether this “more pullback” has started or simply the market is still in a consolidation range (before pulling back). See blue cycles, these 2 possibilities are both possible. So again let’s see tomorrow.

QQQQShortTerm

1.0.9 SPX Cycle Watch (60 min), another cycle turn date is due tomorrow and right now it’s hard to say it means a turning up or down. And again let’s see tomorrow.

SPX60minCycle

1.0.4 S&P 500 SPDRs (SPY 15 min), this chart is “bull friendly”. ChiOsc is way too low, so there’s a chance that we’ll see a rebound at least tomorrow morning.

SPY15min

3.1.2 PowerShares DB US Dollar Index Bullish Fund (UUP 30 min), lots of positive divergences, so US$ could rebound anytime which is “bear friendly”.

UUP30min

INTERESTING CHARTS:

6.4.0 SPX and NYMO Divergence Watch, I’ve mentioned this setup in the weekend report. The sell signal was confirmed today. Again, it’s a risky trade, so the stop loss is very tight, please see trend table above.

SPXandNYMOWatch

2.0.0 Volatility Index (Daily), VIX dropped out of its ENV then rose back into it, this is a “sell short” signal. Just my back test results aren’t good for this setup if the intermediate-term is up, so I won’t read too much into this. Just mention it here for your references only.

VIXDaily

Disclaimer

The information contained on this website and from any communication related to the author’s blog and chartbook is for information purposes only. The chart analysis and the market recap do not hold out as providing any financial, legal, investment, or other advice. In addition, no suggestion or advice is offered regarding the nature, profitability, suitability, sustainability of any particular trading practice or investment strategy. The materials on this website do not constitute offer or advice and you should not rely on the information here to make or refrain from making any decision or take or refrain from taking any action. It is up to the visitors to make their own decisions, or to consult with a registered professional financial advisor.

This websites provides third-party websites for your convenience but the author does not endorse, approve, or certify the information on other websites, nor does the author take responsibility for a part or all materials on the third-party websites which are not maintained by the author.