Live Update

Thursday, December 31, 2009

12/31/2009 After Bell Quick Summary

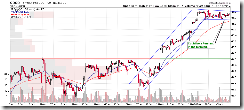
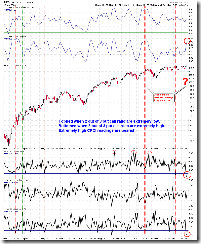
Well, what a dramatic day it was! Although the last minute sharp drop usually didn’t mean anything, we’ll probably see a rebound Monday, but I think the ES (SPX E-mini futures) 60 min chart below gives a clear overall picture: A Bearish 1-2-3 Formation was confirmed. The target area is around 1103.

ES 03-10  12_31_2009 (60 Min)

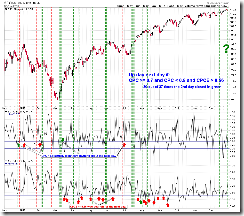
As for the firework I talked about yesterday, apparently, it’s a failed setup.

Firework

Also, according to my proprietary indicator, it foresees, you, my dear readers, a happy and promising 2010. Happy New Year!

1

Wednesday, December 30, 2009

12/30/2009 Market Recap: Bull Flag

Summary:

Could be more push up tomorrow especially QQQQ.

  TREND MOMENTUM EMOTION COMMENT - Sample for using the trend table.
Long-term Up   Disbelieve  
Intermediate Up Neutral  

II Survey: *Record low number of bears.
3.0.0 TNX: Top in a month?

Short-term Up Neutral  

0.0.9 CPC/CPCI: Topped?
1.0.2 SPY: 15 unfilled gaps.
12/23 Recap: Too many bearish extremes.
12/29 Recap: Bearish reversal day.

SPY SETUP ENTRY DATE INSTRUCTION STOP LOSS Mechanic trading signals, details are HERE
Take profit whenever you see appropriate.
ST Model 12/21 L


Breakeven
Reversal Bar 12/21 L

*Adjust Stop Loss

12/30 Low


NYMO Sell  


VIX ENV        
Other Signals 12/28 S 2xATR(10)

2% stop for SPY, 4% for SDS, 5% for BGZ.

INTERMEDIATE-TERM: BREAKOUT BUT I'M NOT CONVINCED

Nothing new, breakout but I'm not convinced, see 12/24/2009 Market Recap for more details.

The latest II Survey, record low number of bears still kicking.

IIBearish 

SHORT-TERM: COULD BE A PULLBACK SOON 

The Santa Rally starting from the Monday so far wasn’t impressive, the SPX rose –0.01% up to date. There’re still 3 days left until Jan 5 for the Santa Rally, let’s see if the market could bring us more pleasant surprise. The bottom line, maintain the view for expecting a bigger pullback soon. 0.0.2 SPY Short-term Trading Signals, so far repeated the same happened after a Black Bar in the past, and so I expect a rebound tomorrow, mostly likely we’ll see a QQQQ new high.

SPYShortTerm 

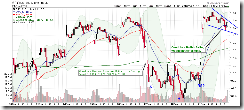
1.1.5 PowerShares QQQ Trust (QQQQ 30 min), 1.0.4 S&P 500 SPDRs (SPY 15 min), Pennant or Bull Flag, especially the QQQQ 30 min chart looks very bullish. In addition, according to today’s After Bell Quick Summary, a green day tomorrow is high likely.

QQQQ30min 

3.1.0 PowerShares DB US Dollar Index Bullish Fund (UUP Daily), black bar, so the dollar could pullback tomorrow therefore it’s also good for the stock market.

UUPDaily 

INTERESTING CHARTS: NONE

12/30/2009 After Bell Quick Summary

One trick today, when CPC < 0.8, 30 out of 37 times (81%) a green day the next day.

CPCWatch

The CPC < 0.8 also triggers a Firework trading setup which had 70% successful rate in the past. Not working good recently, so again pay attention to the past failures (Blue cycles): If small bar again the next trading day or the firework shoots high then falls to the ground on the same day then most likely this is a failed setup.

Firework

Tuesday, December 29, 2009

12/29/2009 Market Recap: Bearish Reversal Day

Summary:

More evidences point to a short-term top coming.

  TREND MOMENTUM EMOTION COMMENT - Sample for using the trend table.
Long-term Up   Disbelieve  
Intermediate Up Neutral  

II Survey: Historical low number of bears.
3.0.0 TNX: Top in a month?

Short-term Up Neutral  

0.0.9 CPC/CPCI: Topped?
1.0.2 SPY: 15 unfilled gaps.
12/23 Recap: Too many bearish extremes.
12/29 Recap: *Bearish reversal day.

SPY SETUP ENTRY DATE INSTRUCTION STOP LOSS Mechanic trading signals, details are HERE
Take profit whenever you see appropriate.
ST Model 12/21 L


Breakeven
Reversal Bar 12/21 L

*Adjust Stop Loss

12/24 Low


NYMO Sell  


VIX ENV        
Other Signals 12/28 S 2xATR(10)

2% stop for SPY, 4% for 2xETF.

INTERMEDIATE-TERM: BREAKOUT BUT I'M NOT CONVINCED

Nothing new, breakout but I'm not convinced, see 12/24/2009 Market Recap for more details.

SHORT-TERM: COULD BE A PULLBACK SOON

Nothing new too, still looking forward to a short-term pullback. Two more evidences:

1. SPY Bearish Reversal Day, take a look at what happened thereafter.

 SPYBearishReversalDay

2. 1.0.9 SPX Cycle Watch (60 min), looks like a cycle top.

 SPY60minCycle

The most recent Indicators At Extremes from www.sentimentrader.com, number of indicators at bearish extremes are still very high.

IndicatorsAtExtremes

The bottom line, no doubt this is an uptrend and the Santa Rally is supposed to end on 1/5/2010, so, sure, bear can bet its luck here, just be cautious, try best not to lose another CLAW AGAIN. LOL

INTERESTING CHARTS: NONE

12/29/2009 After Bell Quick Summary

OK, we got the negative divergence I talked in the last night report, not lengthy enough though, so I’m not sure if there’s another push up tomorrow. The bottom line, I think it’s safe to short here but don’t forget it’s definitely a countertrend trading, so proceed with caution please!

SPY30min

Monday, December 28, 2009

12/28/2009 Market Recap: No Negative Divergence Yet

Summary:

Don't see any short-term negative divergence, so short right here maybe a little premature.

  TREND MOMENTUM EMOTION COMMENT - Sample for using the trend table.
Long-term Up   Disbelieve  
Intermediate Up Neutral  

II Survey: Historical low number of bears.
3.0.0 TNX: Top in a month?

Short-term Up Neutral  

0.0.9 CPC/CPCI: Topped?
1.0.2 SPY: 15 unfilled gaps.
12/23 Recap: too many bearish extremes.

SPY SETUP ENTRY DATE INSTRUCTION STOP LOSS Mechanic trading signals, details are HERE
Take profit whenever you see appropriate.
ST Model 12/21 L


Breakeven
Reversal Bar 12/21 L


Breakeven


NYMO Sell  


VIX ENV        
Other Signals 12/28 S *Short at close. 2xATR(10)

2% stop for SPY, 4% for 2xETF.
*Not a perfect short setup, better wait for the 2nd entry.


INTERMEDIATE-TERM: BREAKOUT BUT I'M NOT CONVINCED

Nothing new, breakout but I'm not convinced, see 12/24/2009 Market Recap for more details.

SHORT-TERM: COULD BE A PULLBACK SOON

As mentioned in the After Bell Quick Summary, a short setup was triggered because of the SPY black bar. Just that reason may not be good enough. Better wait for a negative divergence formed on chart 1.0.3 S&P 500 SPDRs (SPY 30 min). In another word, to trade against a trend, better take the 2nd entry, in our case is to wait the market pullback then rebound to test the previous high then short the pullback.

SPYShortTerm  SPY30min

3.4.1 United States Oil Fund, LP (USO Daily), black bar so oil could pullback which is not good for the stock market.

 USODaily

6.4.5 GLD and UUP Watch, black bar too, so UUP could be up tomorrow at least gaps up, this also is not good for the stock market.

 GLDUUPWatch

INTERESTING CHARTS: NONE

12/28/2009 After Bell Quick Summary

OK, Bears got a potential reversal bar from SPY. Take a look at the chart below, it may mean a down day tomorrow, but it also quite possible there’ll be a new high after the down day before a real pullback so be careful shorting here.

SPYShortTerm

When both SPX and VIX closed in green, 10 out of 18 times (56%) a red day the next day. It’s not much edge but I know some of you will remind me of this, so I list it here simply in order to let you know, yes, I’m aware of this. LOL

SPXVIXWatch

Saturday, December 26, 2009

12/24/2009 Market Recap: Unfilled Gaps, Cycle Turn Date and Block Sell

Summary:

Breakout but I'm not convinced.

Still expect a short-term pullback soon.

  TREND MOMENTUM EMOTION COMMENT - Sample for using the trend table.
Long-term Up   Disbelieve  
Intermediate Up Neutral  

II Survey: Historical low number of bears.
3.0.0 TNX: *Top in a month?

Short-term Up Neutral  

0.0.9 CPC/CPCI: *Topped.
1.0.2 SPY: *15 unfilled gaps.
12/23 Recap: too many bearish extremes.

SPY SETUP ENTRY DATE INSTRUCTION STOP LOSS Mechanic trading signals, details are HERE
Take profit whenever you see appropriate.
ST Model 12/21 L


Breakeven  
Reversal Bar 12/21 L


Breakeven


NYMO Sell      


VIX ENV        
Other Signals   *Sell short if Open > Close   *Signals presented in the short-term comment area are enough to justify a short selling. This is a countertrend trading so for aggressive traders only.

INTERMEDIATE-TERM: BREAKOUT BUT I'M NOT CONVINCED

5.0.1 S&P Sector SPDRs I (Daily), breakout, yes, but since the SPY and QQQQ are not in syn plus the very thin holiday volume, so I'm not convinced.
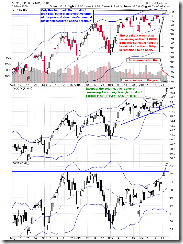
SPYQQQQIWM 

I know you’re now so used to ignore the volume. Well, OK, let me present some other reasons why I'm not convinced.

The chart below shows clearly that COMPQ had the breakout on 5 consecutive unfilled gaps! I don’t remember I’ve ever seen this kind of breakout before. 1.0.2 S&P 500 SPDRs (SPY 60 min), 15 unfilled gaps, the highest record so far this year. 1.1.0 Nasdaq Composite (Daily), even according to the more strict rules, COMPQ has 9 unfilled gaps now, also is the highest record this year.
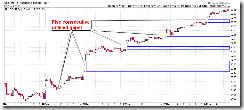
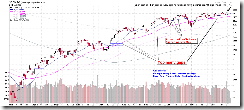
COMPQ15min  COMPQDaily

Let’s take a look at block sell. The chart below highlighted all the SPY block sells for 12/21, 12/22 and 12/24. Apparently the 12/24 SPY block sell was unusual. OK, now let’s look back at the chart 5.0.1 S&P Sector SPDRs I (Daily). It’s the 12/24 bar made the SPY breakout look real, isn’t it? Then, why bigger than usual block sell on the same day?

SPYSellOnStrength 

3.0.0 10Y T-Bill Yield, this chart argues for a top now. Please refer to 8.2.7 Market top/bottom by ROC30 of 10Y T-Bill Yield 2005-2008 and 8.2.8 Market top/bottom by ROC30 of 10Y T-Bill Yield 2001-2004 for the past performances. Surprisingly, this signal worked very well in the past. Of course for calling a top, the signal sometimes could be a month earlier, so for now, we don’t need to worry about much. The actual stuff I want your attentions are:

  1. Yield rose too fast and it has more upside ahead. This is not good for the economical recovery. (What? The economy has already recovered, so it’s OK the mortgage keeps rising. Well, #$%^&#$%!)
  2. Pay attention to the IRX above, the 3 month yield, strangely, it dropped a lot while the market was rising. This is a sign of flight to safety which usually means an imminent pullback.
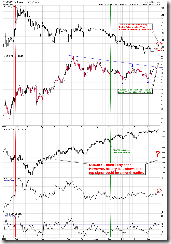
TNXDaily

SHORT-TERM: COULD BE A PULLBACK SOON

I still expect a short-term pullback soon. The main reason still is that there’re too many indicators at bearish extremes in www.sentimentrader.com. The chart below shows a longer history when there’re so many indicators at bearish extremes. Trading wise, if you really want to short this rally, take a look at the trend table above, this is a countertrend trading so better wait for a Bearish Reversal day before taking serious any actions.

IndicatorsAtExtremes 

4.1.1 PowerShares QQQ Trust (QQQQ Weekly), 4.1.9 SPX Cycle Watch (Weekly), it should be more clear on the QQQQ Weekly chart that multiple cycle turn dates are due therefore quite likely the market could turn down the next week.

 QQQQWeekly

Take a look at the chart below, sent by my friend Uempel, he gives almost the same cycle turn date.

 AequalB

INTERESTING CHARTS:

The most recent II and AAII Survey.

 IIBearish AAIIBearish

I think I’ve mentioned this several times, when there’re not many II bears, the market may not be up much.

IIBearishStatistics

Thursday, December 24, 2009

12/24/2009 After Bell Quick Summary

One trick today, a firework (means shoot up high than fall hard to the ground eventually) trading setup was triggered, which had 70% successful rate in the past. I’m not sure about this time but again my purpose here is to provide you with some info, so decide for yourself. Pay attention to the past failures (Blue cycles): If small bar again the next trading day or the firework shoots high then falls to the ground on the same day then most likely this is a failed setup.

Firework

The bottom line, it’s Christmas, so Merry Christmas! And enjoy your holiday!

Wednesday, December 23, 2009

12/23/2009 Market Recap: 41% Indicators at Bullish Extremes

Summary:

Expect a short-term pullback soon.

  TREND MOMENTUM EMOTION COMMENT - Sample for using the trend table.
Long-term Up   Disbelieve  
Intermediate *Up Neutral  
Short-term Up Neutral    
SPY SETUP ENTRY DATE INSTRUCTION STOP LOSS Mechanic trading signals for reference only.
Back tested since 2002.
ST Model 12/21 L


Breakeven
Reversal Bar 12/21 L


Breakeven


NYMO Sell  


VIX ENV        
         

INTERMEDIATE-TERM: BULLISH SEASONALITY BUT MARKET MAY NOT UP HUGE

Nothing new, very bullish seasonality, see12/18/2009 Market Recap, but since the Options Speculation Index is way too bullish so I doubt how high the market could go.

Forgot to mention the chart below yesterday, anyway, a clear Broadening Top breakout on the upside, very good, the text book target is at galaxy far far away, the only problem is that the SPX is not confirming plus the holiday thin volume, therefore need further confirmation after the holiday.

BroadeningTop 

SHORT-TERM: COULD BE A PULLBACK SOON

In short-term, lots of pullback signs are piling up, so be careful.

Among all the indicators in www.sentimentrader.com, today 41% of them are at bullish extremes. The last time I mentioned this was in 12/14/2009 Market Recap when it had 29% indicators at bullish extremes, the market pulled back immediately.

 IndicatorAtExtremes

1.0.4 S&P 500 SPDRs (SPY 15 min), Bearish Rising Wedge plus lots of negative divergences. If the market makes a new high tomorrow but again is unable to up huge then this chart will look even more bearish.

 SPY15min

As mentioned in today’s After Bell Quick Summary, 6.1.9 Extreme ISEE Index Readings Watch and 6.2.4b SPX and VIX Divergence Watch are sounding alarm, plus 0.0.9 Extreme Put Call Ratio Watch mentioned yesterday and the day before, all put together, I think the chances are very good we'll see a pullback soon, maybe not even need wait after the new year.

INTERESTING CHARTS:

The following 2 chars are for fun only, I don’t believe they’re significant.

2.0.0 Volatility Index (Daily), it looks a lot like what happened before the Dubai drama.

VIXDaily

6.4.5 GLD and UUP Watch, GLD black bar means UUP up or at least gap up open tomorrow. The chart was surprisingly accurate. Let’s see if it works again tomorrow.

GLDUUPWatch

12/23/2009 After Bell Quick Summary

Two tricks today, both point to a red day tomorrow or the next next trading day.

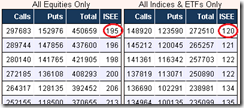
When ISEE Indices & ETFs Only Index > 100, 21 (red and blue arrows) out of 29 times (72%) there’ll be a close that closed below today’s close in 2 trading days.

ISEE ISEEWatch

When both SPX and VIX closed in green 10 (dashed red lines) out of 17 times (59%, a little short of my usual report threshold but since still some people are interested, so I list it here again.) a red day the next day.

SPXVIXWatch

The bottom line, I believe a half trading day tomorrow should generally be bullish but be careful after the Christmas, too many not so good signs have been accumulating, so at least not to chase high here.

Tuesday, December 22, 2009

12/22/2009 Market Recap: 30% Indicators at Bullish Extremes

Summary:

Expect a short-term pullback soon.

  TREND MOMENTUM EMOTION COMMENT - Sample for using the trend table.
Long-term Up   Disbelieve  
Intermediate Down Neutral  
Short-term Up Neutral    
SPY SETUP ENTRY DATE INSTRUCTION STOP LOSS Mechanic trading signals for reference only.
Back tested since 2002.
ST Model 12/21 L

*Adjust Stop Loss

*breakeven
Reversal Bar 12/21 L

*Adjust Stop Loss

*breakeven


NYMO Sell  


VIX ENV        
         

INTERMEDIATE-TERM: BULLISH SEASONALITY BUT MARKET MAY NOT UP HUGE

Nothing new, very bullish seasonality, see12/18/2009 Market Recap, but since the Options Speculation Index is way too bullish so I doubt how high the market could go.

As mentioned in today’s After Bell Quick Summary, something big is going to happen. Unfortunately I don’t know if it’s bullish or bearish. However, 0.0.9 Extreme Put Call Ratio Watch argues for a top again today and this time it adds one more red cycle. So as usual, the cliche: It’s OK to be bullish but proceed with caution.

PutCallRatioWatch 

SHORT-TERM: COULD BE A PULLBACK SOON

No idea about tomorrow. However for all the indicators listed in www.sentimentrader.com, there’re 30% of them at bullish extremes today. The last time I mentioned this was in 12/14/2009 Market Recap, SPY had almost 4 days down swing thereafter. So again, be careful here.

 IndicatorsAtExtreme

INTERESTING CHARTS:

1.4.0 Shanghai Stock Exchange Composite Index (Daily), the Bearish 1-2-3 Formation is confirmed.

SSECDaily

12/22/2009 After Bell Quick Summary

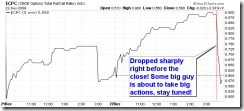
The same as yesterday, CPC closed below 0.7 was not a good sign. And this time it’s even more suspicious because right before the close, CPC dropped sharply below 0.6. It was due to a huge index call transactions. Whether this guy bought this huge call to hedge his position (bearish) or he knows that the market’s going to rally really really big (bullish), depends on whether you have bull or bear eyes. Personally, I don’t know. I just know something big is going to happen. Tighten your belt!

 CPC5min IntradayVol

When CPC < 0.7, 9 out of 15 times (60%) a red day the next day. Well, I know it didn’t work well recently, but the point is 0.0.9 Extreme Put Call Ratio Watch. Pay attention to it tonight after 7:40 ET, I’m pretty sure a top condition was met AGAIN as both CPCI and CPC are way too low.
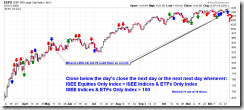
CPCWatch

Monday, December 21, 2009

12/21/2009 Market Recap: Put call ratio a little too bullish

Summary:

May still have some up room but could be very close to a short-term top.

  TREND MOMENTUM EMOTION COMMENT - Sample for using the trend table.
Long-term Up   Disbelieve  
Intermediate Down Neutral  
Short-term *Up Neutral    
SPY SETUP ENTRY DATE INSTRUCTION STOP LOSS Mechanic trading signals for reference only.
Back tested since 2002.
ST Model 12/21

*Long intraday

*12/18 Low *No confidence in this trade.
Reversal Bar 12/21

*Long intraday

*12/18 Low

*No confidence in this trade.

NYMO Sell  


VIX ENV        
         

NTERMEDIATE-TERM: BULLISH SEASONALITY BUT MARKET MAY NOT UP HUGE

Nothing new, very bullish seasonality, see 12/18/2009 Market Recap, but since the Options Speculation Index is way too bullish so I doubt how high the market could go.

0.0.9 Extreme Put Call Ratio Watch, this chart confirmed the extreme bullishness of the Options Speculation Index. Although it may only argue for a short-term top (see red dashed lines), but put it here could make my point more clear: OK to be bullish but proceed with caution. We believed a strong Thanksgiving yet it failed; We believed the last option expire week is bullish but it failed again; Now how about Santa Rally?

ExtremePutCallRatioWatch 

SHORT-TERM: COULD UP

1.0.4 S&P 500 SPDRs (SPY 15 min), could be a Bullish Falling Wedge in the forming therefore the market could be up at least tomorrow morning.

SPY15min 

1.0.2 S&P 500 SPDRs (SPY 60 min), looks bullish too on a little bit longer time frame, could be an Ascending Triangle in the forming. The only catch is that there’re too many unfilled gaps. Looks to me the SPY simply couldn’t hold its 14th gap recently. So if SPY gaps up again tomorrow morning but the gap is not large enough to break above the Ascending Triangle resistance line then chances are good that the gap will be filled and in this case be sure to check whether a Bearish Reversal day is formed.

SPY60min 

INTERESTING CHARTS: NONE

12/21/2009 After Bell Quick Summary

OK, CPC closed at 0.6, I think the bull wagon is crowded.

CPCWatch

Pay attention to chart 0.0.9 Extreme Put Call Ratio Watch tonight after 7:40 ET, I’m pretty sure a top condition was met as both CPCI and CPC are way too low and actually CPCE should be closed around 0.5 which also is quite low. Holiday effect, so extreme put call ratio doesn’t count? Well, I don’t know. Better be careful than sorry, I think.

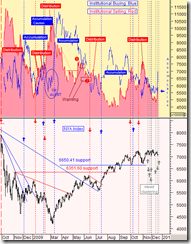
Institutional Buying and Selling Trending

Institutional Buying and Selling Trending from www.stocktiming.com. The original comment:

Currently:  Institutional Investors moved to Accumulation on Friday ... this occurred in the last minute of trading and we don't know if it was related to options expiration or not.  The last minute level tripled the average level for the day.  Institutional Buying increased, and Institutional Selling increased.

1

Disclaimer

The information contained on this website and from any communication related to the author’s blog and chartbook is for information purposes only. The chart analysis and the market recap do not hold out as providing any financial, legal, investment, or other advice. In addition, no suggestion or advice is offered regarding the nature, profitability, suitability, sustainability of any particular trading practice or investment strategy. The materials on this website do not constitute offer or advice and you should not rely on the information here to make or refrain from making any decision or take or refrain from taking any action. It is up to the visitors to make their own decisions, or to consult with a registered professional financial advisor.

This websites provides third-party websites for your convenience but the author does not endorse, approve, or certify the information on other websites, nor does the author take responsibility for a part or all materials on the third-party websites which are not maintained by the author.