Live Update

Thursday, February 26, 2009

02/26/2009 Market Recap: Firework still possible but be prepared for the worst

The chances of firework (A firework means the market skyrockets high for a few days, then falls hard to the ground.) is diminishing upon today's sell off. I still see a possible firework, just not very confident now. As mentioned in the yesterday's report, we may see the worst case: Statistically, if a Major Accumulation Day happens near a new close low, that low usually holds before a firework kicks in. However there were some cases that the new close low didn't hold. The worst case was Nov 20 to 23 last year where the SPX had closed bellow that low for another 3 days. So be prepared for the SPX to close bellow 743.33 for at least 3 days. Tomorrow, however, the market may bounce and probably could close green.

MADandCPC


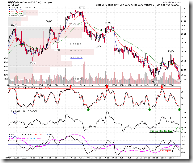
Bad news first: 0.0.2 SPY Short-term Trading Signals, looks like a Bear Flag to me, so be prepared, the down leg hasn't done yet.

SPYShortTerm

Now good news, before the down leg begins, still possible we may see a firework.

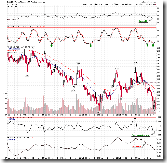
0.0.4 SPX:CPCE, buy setup triggered today, it was very profitable recently, hope this time it still works. By the way, this is how the word "firework" comes from.

SPXvsCPCE

1.1.5 PowerShares QQQ Trust (QQQQ 30 min), 1.1.6 PowerShares QQQ Trust (QQQQ 15 min), STO oversold, ChiOsc way too low, these mean a bounce at least tomorrow morning.

QQQQ30min

QQQQ15min

7.0.4 Extreme CPC Readings Watch, CPC < 0.8, 14 out of 21 times (67% chances) the next day closed green.

CPCWatch

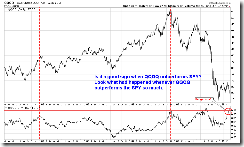
OK, if you don't see 67% chances are good chances, let's have a look at "Odd Lot Purchase Percentage" chart from www.sentimentrader.com, this chart represents retail traders who are considered as contrarian, today it fell out of the green curve at bottom which means that we retailers were scared to death. Pay attention to the vertical green lines, looks like every time that we retailers were scared to death, the next day the market always closed green. :-)

OddLotPurchasePercentage

Wednesday, February 25, 2009

02/25/2009 Market Recap: New Low or Firework?

The sell off before close might mean nothing, very short-term the market was very overbought, so even without the sell off before the close, we'd see a pullback tomorrow morning. Tomorrow could be critical to determine the market's true direction.


1.0.5 Major Accumulation/Distribution Days, yesterday was a so called Major Accumulation Day or as other called "90% day" (see chart bellow, it's defined as a day with green bar higher than the horizontal blue line). Although we've got lots of Major Accumulation Days recently, but the one we had yesterday was very unique, it happened near new low. Statistically, after such kind of Major Accumulation Day, market usually fireworks first then might or might not test the previous low. The only exception was Oct last year. Bellow, we'll see, since Oct last year, how the firework went after a Major Accumulation Day formed near new low.

MADandCPC

As illustrated above, I can see 4 things:

1. Closed red today is quite normal after a Major Accumulation Day, so again, it (closed red) didn't mean anything.

2. Tomorrow shell be critical to determine the market's true direction. Looks to me, the reason for no firework in the last Oct was because CPC was not low enough.

3. Actually, the last Oct did have a firework, it just happened too fast - only lasted one and half day.

4. Even if no firework tomorrow, like what had happened last Oct, the worst (if past statistics still work) is to test the Monday low which seems not as scary as that of last Oct, right?

OK, what if Monday low was broken tomorrow? After all, the past statistics cannot guarantee the history 100% repeats itself. Look at the chart bellow, courtesy of www.sentimentrader.com, NYSE Cumulative TICK, pay attention to green cycles, short-term, intermediate-term or whatever-term, the market is rather closer to a bottom than a top, right?

NYSECumTICK

So, the conclusion: Bulls should not be too worried as long as the current position is not heavy.


1.0.3 S&P 500 SPDRs (SPY 30 min), possible Head and Shoulders Bottom in the forming which means if we do see firework, the target is around $81.93.

SPY30min

3.4.2 United States Oil Fund, LP (USO 30 min), very short-term, oil is overbought, period.

USO30min

Tuesday, February 24, 2009

02/24/2009 Market Recap: A CPC's Tale

CPC dropped bellow 0.8 today, so we may see a firework again. What is firework? Skyrocketing high then (maybe after a few days) drop to the ground. Very short-term, the market is overbought, so should pullback at least tomorrow morning.


7.0.4 Extreme CPC Readings Watch, this is the today's tale: CPC closed bellow 0.8, 14 out of 20 times recently, the second day closed green. Also in my previous report, I mentioned that CPC closes bellow 0.8 may mean several consecutive up days until one day the market opens with big gap down, so if tomorrow the market closes green again, bears should be careful about the possible coming firework.

CPCWatch

0.0.3 SPX Intermediate-term Trading Signals, NYADV and NYUPV (blue and red curves) look promising, so this is another reason, if tomorrow the market closes green, bears should be careful.

SPXMidTerm

1.0.3 S&P 500 SPDRs (SPY 30 min), this is why I said the market may pullback at least tomorrow morning: STO overbought while ChiOsc is a little bit too high.

SPY30min

7.0.1 Extreme NYADV and NYMO Readings Watch, even the market drops tomorrow, bulls should not worry too much as very likely the "ultimate oversold" signals will be oversold again.

NYADVandNYMO

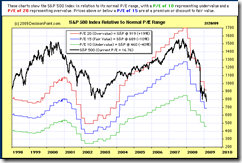
SPX Relative to Normal P/E Range

I was just kidding about SPX 400 target but I've got a reply saying SPX 600 target is based on P/E. I don't know if it's true or not, just want to share with you an interesting chart from www.decisionpoint.com:

SPXPE

Monday, February 23, 2009

Why 1997 lows?

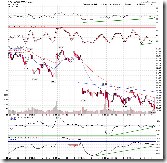
OK, someone asks for why I said SPX may test 1997 lows in today's report? It's just a guess, since 741 is not far away and I believe Mr market needs something more scary. :-) Also from the chart, some serious supports are around 400. Why lots people say 600? I don't see much support around 600. :-)
SPXMonthly

02/23/2009 Market Recap: A TICK's Tale

Before today's report, I want to say two things first:

1. I still think there'll be a rebound. After all, oversold like 7.0.1 Extreme NYADV and NYMO Readings Watch is rare, worth of betting. So I took long last Friday. Well, the point is how much? 2% of my total capital. Yes, I didn't write it wrong, it is 2%.

2. I've noticed accidentally that since last November, all my losing trades were LONG positions, there was not a single losing SHORT position.

So, what the above tells me? Long is dangerous when the primary trend is down, no matter how good chances the TA signal says.


Today's Russell 3000 Dominant Price-Volume Relationships was 1666 stocks price down volume down. This is a bad news which means no panic, therefore we may see another sell off tomorrow. The good news is we might have an intraday reversal tomorrow.


The reason for an intraday reversal: 7.0.3 Extreme TICK Readings Watch, when TICK closes bellow -1000, the next day tends to have an intraday reversal. So ideally, SPX may drop bellow the 1997 low at 729.55 to fulfil the prophecy made by  1.2.0 INDU Leads Market first, then reverse higher tomorrow. From the chart, we can see an exception in last Nov, so the worst case, the market could rebound the day after tomorrow.

TICKWatch

I won't mention all the oversold/positive divergence signals today, they were all in 02/20/2009 Market Recap: Finally Oversold, still there and more oversold.

7.0.1 Extreme NYADV and NYMO Readings Watch, the "ultimate" oversold signals, day 2 bellow oversold. The worst case is the last Oct, rebounded on day 4. Hmm, if rebounds on day 4 then it fits for chart 7.0.3's worst case prophecy, interesting.

NYADVandNYMO

0.0.3 SPX Intermediate-term Trading Signals, intermediate-term NYADV and NYUPV are oversold. Market usually rebounds when NYUPV (red curve) crossover above NYADV (blue curve), we're not there yet, be patient.

SPXMidTerm

I heard lots of saying that oversold can be more oversold, so if you believe that this market can drop another 6 days or more and therefore want to short now, here's a chart for you: 1.1.7 QQQQ Outperforms SPY Good Sign?, QQQQ may just start dropping. For me, it is true there're no 100% correct TA signals and extremely oversold may or may not work this time, but as I kept saying before, I try my best not to think that this time is different and therefore because of the extremely oversold conditions, I shell still see a rebound. :-)

QQQQvsSPY

Sunday, February 22, 2009

02/20/2009 Market Recap: Finally Oversold

Friday's Russell 3000 Dominant Price-Volume Relationships has finally confirmed that the market is oversold, so we shell have a bounce sometime next week. And since I haven't seen any signs of bottom yet, I believe it's a tradable bounce only, not a bottom.


Bad news first: 1.2.0 INDU Leads Market, 10 year new low! Although some newsletters consider INDU new low without SPX's confirmation to be a positive divergence, but according to chart 1.2.0, if the past rule still applies, I believe that SPX will follow INDU, eventually will have a new low. Besides, again, 0.0.1 Market Top/Bottom Watch has not a single bottom signal yet.

INDULeads


1.3.7 Russell 3000 Dominant Price-Volume Relationships, 1479 stocks price down volume up, finally oversold. Look at the chart, starting from Feb 9, these are series of typical downside price-volume relationships, where at the very beginning, the "price down volume up" was bearish, and during the down trend, the "price down volume down" (not annotated on the chart: either "price up volume up" or "price down volume down") was a sign of continuation, and finally "price down volume up" again which is bullish because it means a possible capitulation.

RUA

2.3.4 Nasdaq Total Volume/NYSE Total Volume, looks like a short-term bottom to me.

NATVvsNYTV

0.0.2 SPY Short-term Trading Signals, perfect bounce setup, well, as long as you don't consider the "perfect" as a contrarian sign.

SPYShortTerm

1.0.3 S&P 500 SPDRs (SPY 30 min), 1.0.4 S&P 500 SPDRs (SPY 15 min), lots of positive divergence arguing for a rebound as well.

SPY30min

3.1.0 PowerShares DB US Dollar Index Bullish Fund (UUP Daily), Bearish Engulf, Bearish Rising Wedge, dollar should drop further which is good for commodities.

UUPDaily

5.0.2 S&P Sector Bullish Percent Index, looks like there's not much room for Financials to drop.

BPFINA

5.2.0 Energy Select Sector SPDR (XLE Daily), right on the support, XLE should rebound.

XLEDaily

And lots of oversold signals from various angles bellow. So again, looks like a "rare" "perfect" sign of a tradable bounce. I'm not a fan of "contrarian", but in case the market is sold off again next week, if I have long, I might turn off the computer and pretend that nothing has happened. LOL

Liquidity Flow and Institutional "shift in direction" from www.stocktiming.com.

rain

SPX Climactic Volume Indicator and SPX Price Momentum Oscillator from www.decisionpoint.com.

SPXCVI SPXPMO

NYSE 4 Weeks New High/Low Ratio from Telechart.

T2122

Thursday, February 19, 2009

02/19/2009 Market Recap: No Panic Yet

First of all, correct an error in yesterday's report: According to http://quantifiableedges.blogspot.com/2009/02/2-gaps-down-revisited.html, the latest day for SPY to close above $80.16 is next Monday not this Friday.


From indicator point of view, the market is very oversold. So it could bounce at any time, and I really wish I could know exactly when. However, today's Russell 3000 Dominant Price-Volume Relationships has 1153 stocks price down on decreased volume arguing that the volume has not confirmed the oversold condition yet, so it's still possible we may see another sell off tomorrow. Bears better take some profits if we do have a sell off again tomorrow because it's rare for SPX to be down more than 5 days in a row. Bulls, be patient, not too hurry bottom fishing, as today's report will review my "ultimate oversold" indicators, which in the worst case like Oct 2008, may stay at oversold level for another 3 days.


0.0.0 Signal Watch and Daily Highlights, lots of short-term green, market is very oversold.

SignalWatch

1.0.3 S&P 500 SPDRs (SPY 30 min), 1.0.4 S&P 500 SPDRs (SPY 15 min), lots of positive divergence, which means, under NORMAL CONDITIONS, we should see a bounce tomorrow.

SPY15min

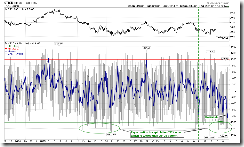
OK, now let's see my "ultimate oversold" indicators, 7.0.1 Extreme NYADV and NYMO Readings Watch. Whenever both NYADV and NYMO are oversold, the market usually bounces the next day. The only exception was Oct 2008 when the indicator stayed at the oversold level for another 3 days. So, if you really really want to do bottom fishing, better plan the worst case according to this indicator.

NYADVandNYMO


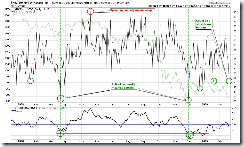
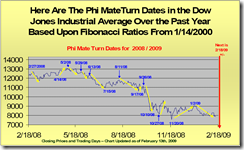
My GUESS is that the market is likely to bounce next Monday. The reasons, except the above mentioned statistics which says SPY will close above $80.16 no later than next Monday and 7.0.1 Extreme NYADV and NYMO Readings Watch at that time will be very oversold, according to https://www.technicalindicatorindex.com/, its "Fib Cluster Event" and "Phi Mate Turn Date" have both pointed out the next Monday as a bottom.

FibClusterEvent

PhiMateTurnDates

If we do have a bounce tomorrow, it's actually a bad news for bulls as that means an orderly retreat and therefore the selling is far from over. Please refer to chart 0.0.1 Market Top/Bottom Watch for conditions about the bottom. Also even the market rebounds on Monday or after several more consecutive down days, we still need to refer to chart 0.0.1 Market Top/Bottom Watch to see if the market has bottomed or not. So far, none of bottom conditions are met.

TopBottomWatch

Wednesday, February 18, 2009

02/18/2009 Market Recap: SPX down 3 days in a row

I think there're good chances that SPY will close above the Tuesday's open which is $80.16 either tomorrow or Friday.


This is where the $80.16 idea is from: http://quantifiableedges.blogspot.com/2009/02/2-gaps-down-revisited.html. Because on Tuesday SPY had a larger than 2% gap down, so statistically within 4 days, SPY should close above the Tuesday's open which is $80.16.

SPX has been down 3 days in a row now, which is kind of a good news as from chart 7.0.5 SPX Climax Sell Watch, at least in the past year, there were only 2 cases that SPX was down more than 3 days in a row.

SPXClimaxSellWatch

OK, enough statistics, let's talk about signals:

7.1.2 NYSE - TICK (30 min), blue curve, which is 3 day moving average of the TICK, has reached a two months low today, very oversold. A rebound should be close.

TICK

1.1.5 PowerShares QQQ Trust (QQQQ 30 min), ChiOsc is till very low, a rebound is sill possible.

QQQQ30min

3.4.1 United States Oil Fund, LP (USO Daily), green dashed vertical lines, USO rallied when both RSI2 and STO had reached certain oversold level. Now we have this setup again with an additional help of extremely low ChiOsc readings. I believe this is also good for the overall market.

USODaily

1.4.0 S&P/TSX Composite Index (Daily), USO rally should help the Canadian market. RSI2, STO and ChiOsc on TSX daily chart also argue for a rebound.

TSXDaily

If, however, the market crashes tomorrow and Friday, I'll review some very reliable oversold signals, which will be very helpful for guiding bulls to fight back.

Tuesday, February 17, 2009

02/17/2009 Market Recap: Breakdown!

Three points to say:

1. Trading range was broken on the downside today plus lots of newly generated intermediate-term sell signals (0.0.0 Signal Watch and Daily Highlights). This means an intermediate-term down leg has began. Is it possible that today's breakdown was a faked one? Well, even so, as I have mentioned in 02/11/2009 Market Recap: Consolidation Day, the upside is limited. So looks to me that bears are safe while any rally is a gift to bulls.

2. When will be a bottom (if not the bottom)? It's time to pay attention to chart 0.0.1 Market Top/Bottom Watch. Not yet so far. If the market keeps selling off tomorrow, we'll probably review some reliable oversold signals in tomorrow's report. Right now, yes, the market is a little oversold, but not enough for buying a dip in this dangerous bear market.

3. A bounce might be at least tomorrow morning.


0.0.2 SPY Short-term Trading Signals, range breakdown which means a confirmed Double Top targeting $74.88. NYADV is a little oversold, good, but since NYADV formed a lower low today, this means that SPY will have a close which is lower than today's close. Why? Please read annotations in chart 2.4.2 NYSE - Issues Advancing.

SPYShortTerm

1.0.3 S&P 500 SPDRs (SPY 30 min), ChiOsc is way too low, this is the main reason that I think the market will have at least 2 hours (4 candlestick bars) bounce tomorrow. For other 30 min chart, such as QQQQ, IWM, XIU.TO, they all have the same ChiOsc extreme readings. By the way, for everyday's report, if all the indices charts look the same (QQQQ, IWM, XIU.TO, XLE, XLF etc), I'll only annotate the SPX chart. I really don't have time for updating all of them.

SPY30min

1.3.7 Russell 3000 Dominant Price-Volume Relationships, 1974 stocks price down volume up which means the market is oversold. From the chart, pay attention to all the green annotation boxes, looks like recently, whenever, price down volume up relationships appear, the second day tends to close green.

RUA


1.4.0 S&P/TSX Composite Index (Daily), from TOAD and BB Width, even TSX was down a lot recently, it seems that TSX is still closer to a top then a bottom.

TSXDaily

1.0.5 Major Accumulation/Distribution Days, two Major Distribution Days so far now, which means either a good bounce is due or there'll be a third Major Distribution Day.

Sunday, February 15, 2009

02/13/2009 Market Recap: No Follow-through

Two points to be noticed that:

  • The market did not follow through the reversal on Thursday, and this is no good;
  • Most signals are neutral, so the future direction is unknown.  However I got a few interesting charts for your information.

image

1.1.7 QQQQ Outperforms SPY Good Sign?  This is a reminder (not even a warning) that QQQQ:SPY is too high.  Please note that I am not saying QQQQ is going to sell off immediately, eventually it will pay back, but when?  I have no idea.

image

Institutional Buying and Selling Trending from www.stocktiming.com, here is the explanation from the author:

The Institutional Selling shows its trend line making higher/highs and higher/lows ... the definition of an up trend.  The Institutional Buying shows its trend line making higher/highs and higher/lows ... the definition of an up trend.  Institutions are showing an up-trend in BOTH ... buying and selling.   This behavior does not indicate what their predominant intention is.  This could mean they are rotating sectors, and/or setting up hedges.

I notice that the setup on the chart looks similar in last September when we saw a firework.

image

News Driven Market from www.tdtrader.com.

image

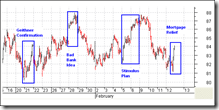
Compare the above chart with the following one, every time prior to the news pop market, CPC is waiting at the extremely low reading, isn't it?  Now, the CPC reading doesn't show much enthusiasm to the Wednesday Mortgage Relief Plan, does it?  The third time it will be different -- I guess the market will either sell off from Tuesday, or rally without sell on news and continue to go higher afterward.  In another words, the market direction on Tuesday could possibly be the real direction.  Lastly just to remind you that this is a wild guess, not TA, and should not be take as a guide to trading.

image

Disclaimer

The information contained on this website and from any communication related to the author’s blog and chartbook is for information purposes only. The chart analysis and the market recap do not hold out as providing any financial, legal, investment, or other advice. In addition, no suggestion or advice is offered regarding the nature, profitability, suitability, sustainability of any particular trading practice or investment strategy. The materials on this website do not constitute offer or advice and you should not rely on the information here to make or refrain from making any decision or take or refrain from taking any action. It is up to the visitors to make their own decisions, or to consult with a registered professional financial advisor.

This websites provides third-party websites for your convenience but the author does not endorse, approve, or certify the information on other websites, nor does the author take responsibility for a part or all materials on the third-party websites which are not maintained by the author.