SHORT-TERM: COULD SEE PULLBACK AS EARLY AS TOMORROW
Three cents:
- Could see red tomorrow.
- Pullback, if any, is buy, as most likely today’s high is not the high.
- Still cannot exclude the Bear Flag case on SPX daily chart. A pullback if any would provide enough info to identify whether this merely is a pullback or something more.
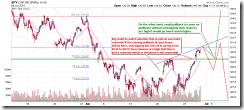
Firstly let’s take a look at the evil plan mentioned yesterday. Now the Symmetrical Triangle case can be excluded but it seems Bear Flag still OK, so strictly speaking, today’s market action still cannot confirm whether the correction is over.

The chart below illustrated what I’ll watch the next. The thick green line is the key, breakdown below it then it’s price overlap so the last 3 days’ rally is merely a rebound therefore destined to fail. On the other hand, if the pullback stops above the green line or even there’s no pullback at all, then most likely more up ahead. This is based on the Elliott Wave theory, impulse wave up cannot overlap while if overlap, then it’s a corrective wave therefore destined to fail. I know some of you don’t like Elliott Wave. Well, don’t be, Elliott Wave is actually based on the price pattern, if you’ve watched my intra-day comments then you’d know that patterns are very effective in predicting the market movements, so as long as you understand the essences behind the Elliott Wave, the theory can be very useful.

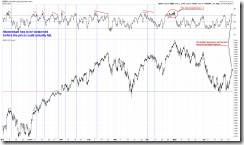
I know, after seeing the chart above, some may ask, why I’m sure after a pullback there’ll be one more push up? The chart below explains why: RSI negative divergence is needed. What’s the theory behind this RSI phenomenon? Well, it’s the law of inertia, a forward accelerating car cannot be reversed before slowing it down first. RSI measures acceleration not the speed itself, so acceleration must be slowed first before speed itself can be slowed.

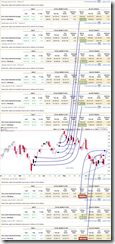
Then why expect a red tomorrow? I’ve mentioned the reasons in 06/28 Market Outlook, seasonality bearish tomorrow, plus NYADV too high means either red today or tomorrow. Because today is green so most likely tomorrow will be red.

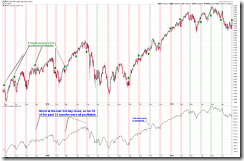
One unique thing I’d like your attention today is the very negative money flow. Although officially, in today’s Trading Signals, both intermediate-term and short-term are up but this up is not without a doubt: The chart below compared the money flow in the recent 3 days rally to the past similar cases, clearly we can see, although the bars we have are much more pretty than before but unlike the past, block trades are selling hard into the strength which I don’t think is a good sign. Well, maybe it’s nothing, but let’s just remember this here, in a few days we’d know whether it does mean something or not.

INTERMEDIATE-TERM: MORE SELLING AHEAD
See 06/24 Market Outlook for more details.
SEASONALITY: BEARISH THURSDAY BULLISH FRIDAY
See 06/24 Market Outlook for more details. Also, see 06/24 Trading Signals for seasonality surrounding the Independence Day.
ACTIVE BULLISH SIGNALS:
ACTIVE BEARISH SIGNALS:
ACTIVE BULLISH OUTLOOKS:
ACTIVE BEARISH OUTLOOKS:
HIGHLIGHTS OF THE OTHER ETFS IN MY PUBLIC CHART LIST:
| |
- * = New update; Blue Text = Link to a chart in my public chart list.
- UP = Intermediate-term uptrend. Set when weekly buy signal is triggered.
- DOWN = Intermediate-term downtrend. Set when weekly sell signal is triggered.
|


