Live Update

Thursday, July 31, 2008

07/30/2008 Market Recap: Important test for SPX monthly prediction tomorrow

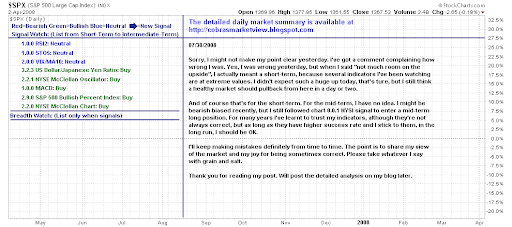
Today I received an email of complaining my inaccurate prediction.  Then I realized the yesterday's title is not entirely accurate, or in some sense a bit misleading.  When I said "not much room left on the upside", I meant short-term we should expect a pullback.  Obviously the market pulled back significantly in the mid-day, which show my analysis is correct although the market finally went up.  My concern is that a few indicators are not corrected to the right level due to the afternoon rally, which is not a good news for bulls.  Anyway I will make my analysis clear in term of timing, i.e. short-term or mid-term, as it is expressed on 0.0.0 Signal Watch and Daily Highlights.

0

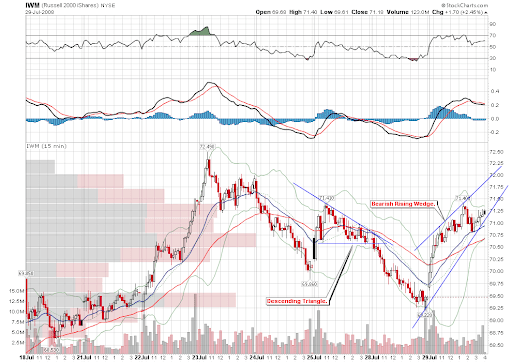
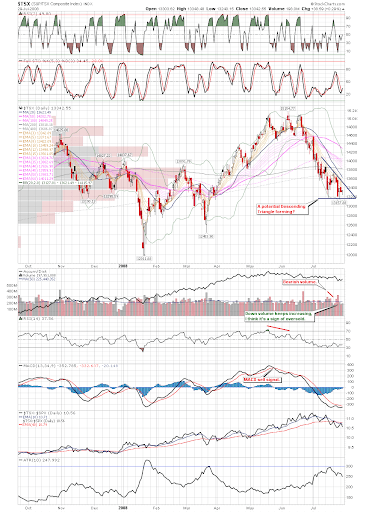
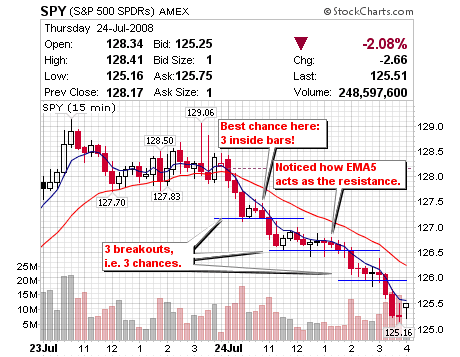
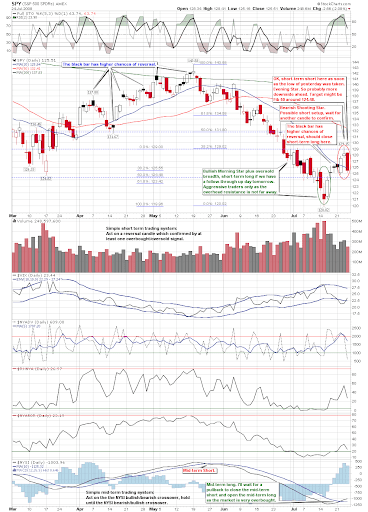
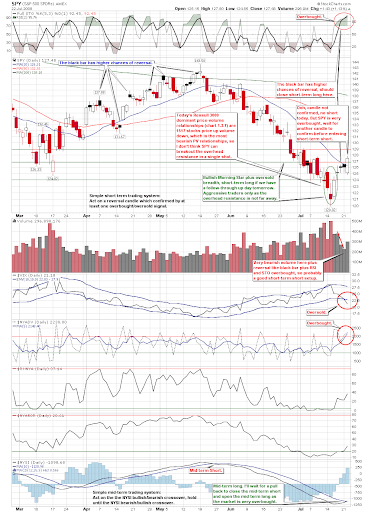
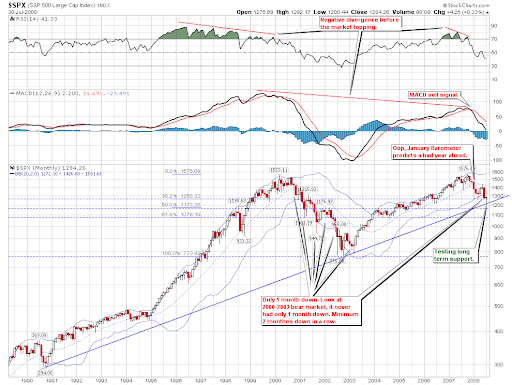
The indicators I discussed yesterday have not changed so much today.  But tomorrow is the last day of July, and it is time to validate my previous observation that at least two months down in a row in a bear market on 1.0.2 S&P 500 Large Cap Index (Monthly).  Currently the candle is a cross.  I have no strong evidence to show tomorrow the market will be down, but it's a bit overbought on 5-min and 15-min intraday charts, so tomorrow we should see at least a pullback.

1

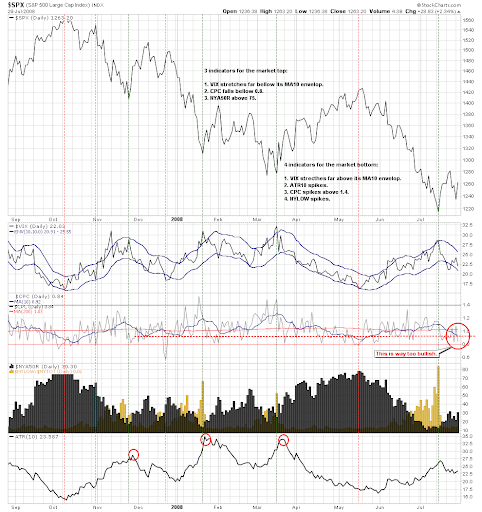
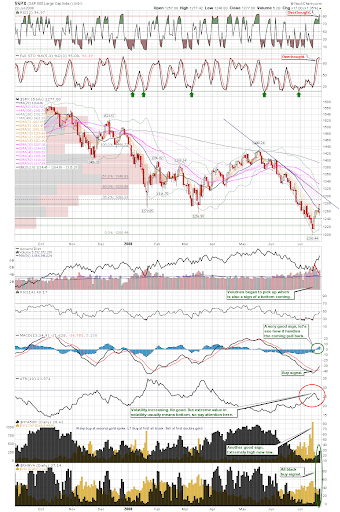
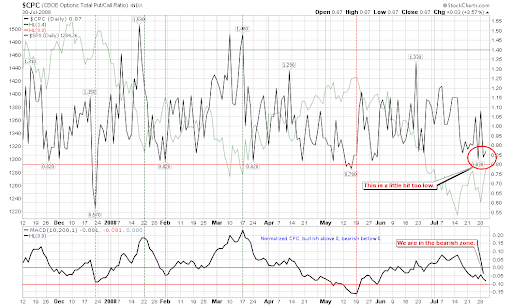
2.8.1 CBOE Options Total Put/Call Ratio.  This has worried me for a while.  According to Dr. Brett Steenbarger's observation on MA(10) and MA(200) of CPC, when MA(10) was below MA(200) usually the market was topped out.  Of course the problem is that it is not clear how deep the MA(100) goes below MA(200) the market will be at the top precisely.  In the past, -0.1 is near the top, and now it is not there yet, nevertheless it's better to be cautious.  During the March rally, MA(10) was above MA(200) for a month and then went below for a month.  Now MA(10) has stayed below MA(200) for 10 trading days, which is about a half of one month (or 20 trading days).  And that's a part of the reason why I said "not much room on the upside".  I am not saying the market will go down immediately, it is not entirely impossible that the market goes up 200 points in a day, or 2000 points within 10 days.  I probably should say not much time left.  Anyway, this chart does tell you the immediate direction, it just remind you where the market is at the moment.

2

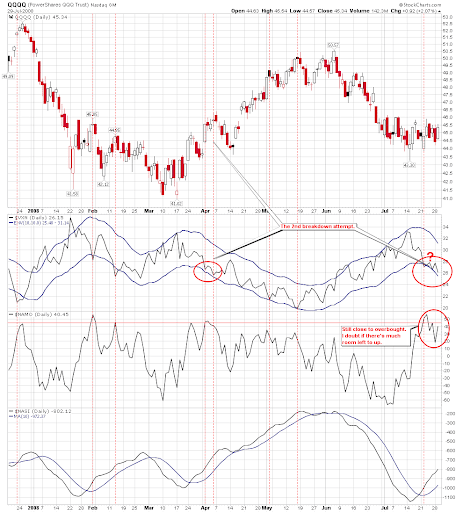
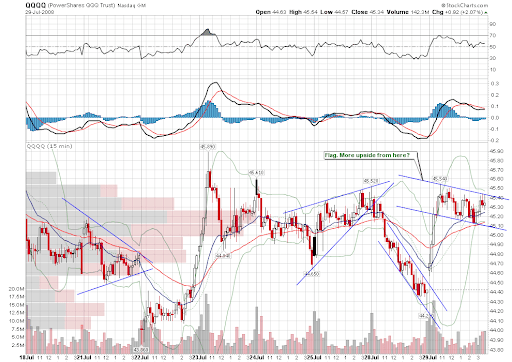
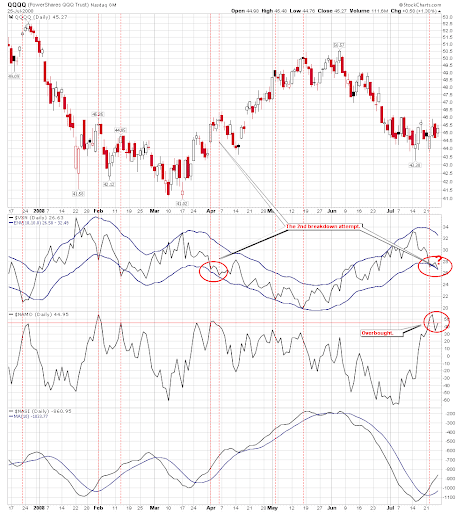
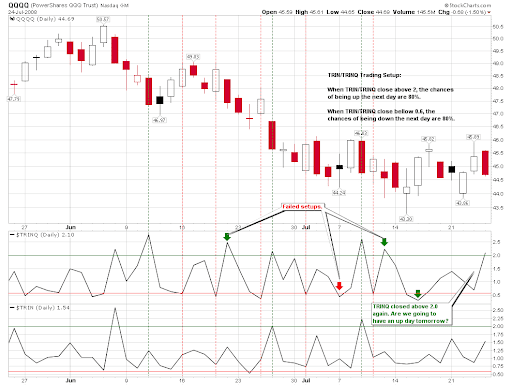
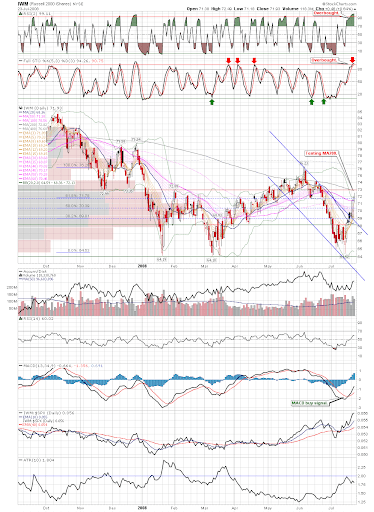
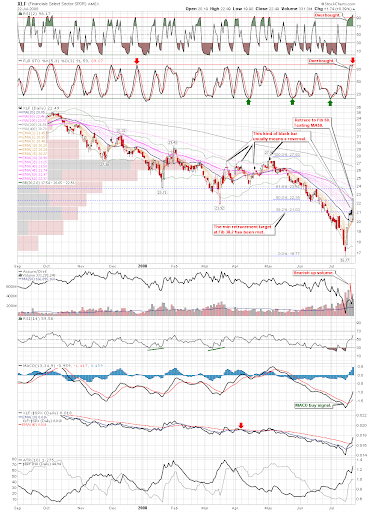
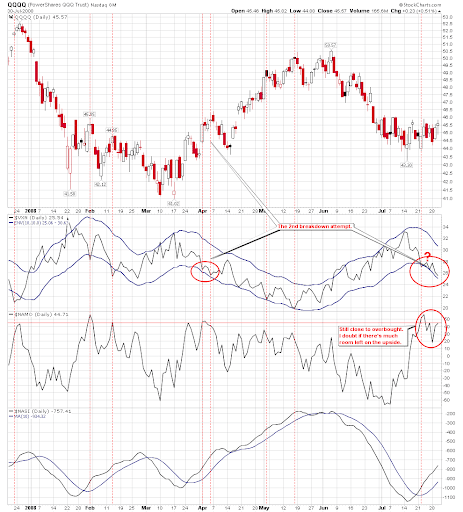
1.1.B QQQQ and VXN.  Yesterday I said NAMO was nearly overbought, now it is.  You may have witnessed the accuracy of overbought Breadth indicators.  Therefore if QQQQ continues to rally tomorrow, I think the probably of shorting could be fairly high.

3

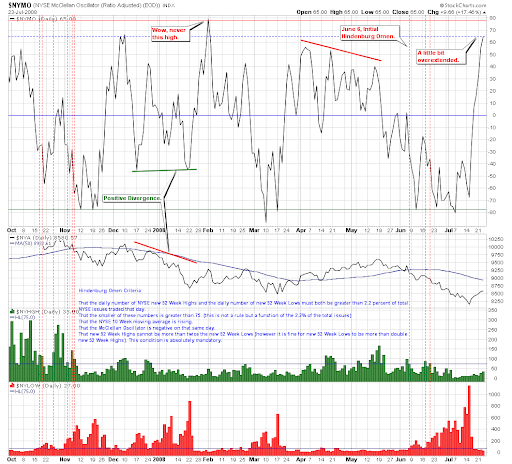
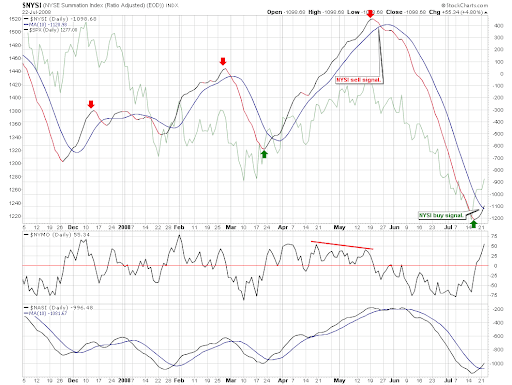
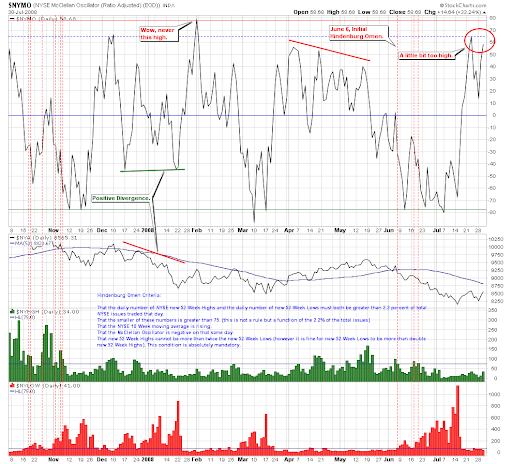
2.2.1 NYSE McClellan Oscillator.  It is a bit high but not overbought yet.  Just a warning.

4

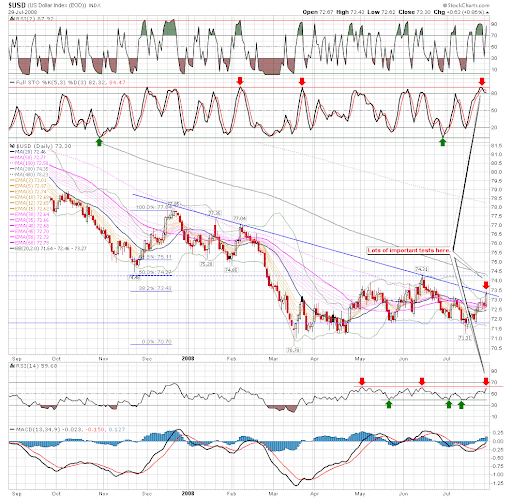
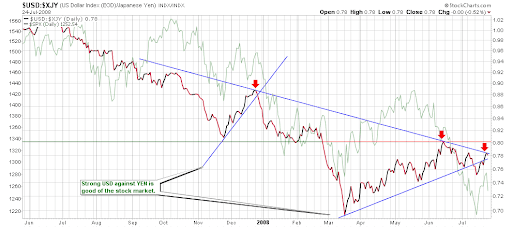
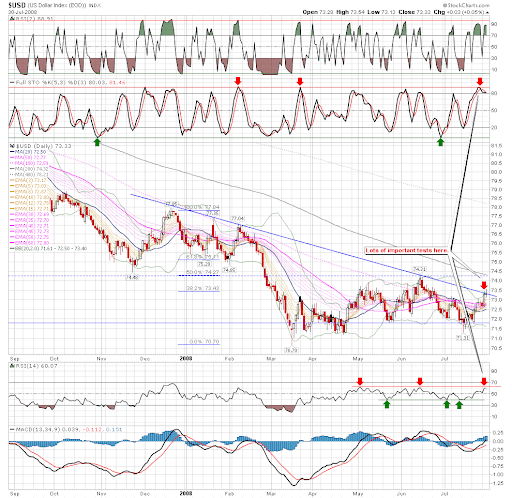
3.1.0 US Dollar Index (Daily).  The important test that I mentioned yesterday has not passed yet.  Tomorrow the test will continue.

5

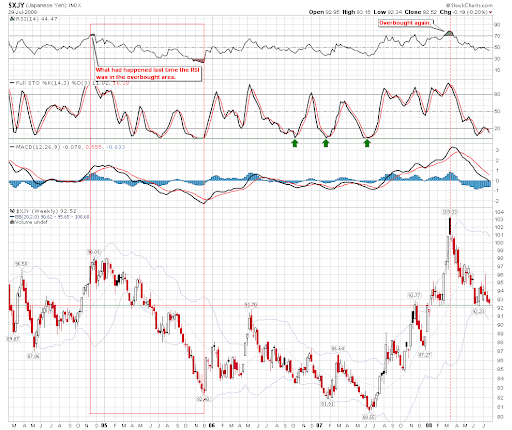
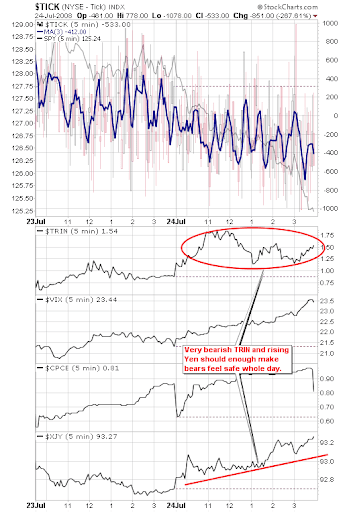
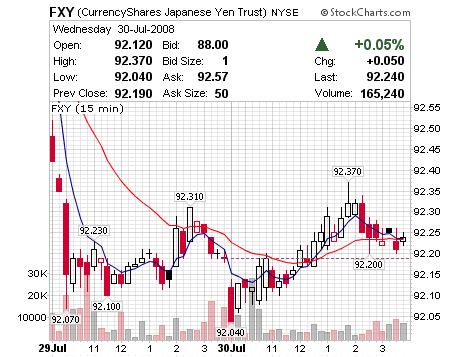
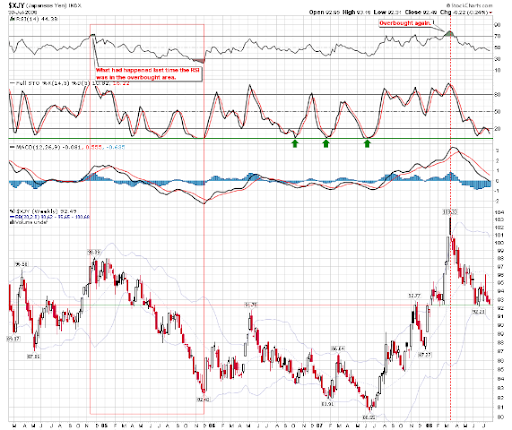
3.2.1 Japanese Yen (Weekly).  Japanese Yen is still on a key support.  On the 15-min chart, it was pulled up impressively.  If tomorrow it follows through, it is going to be very bearish to the stock market.

6

7

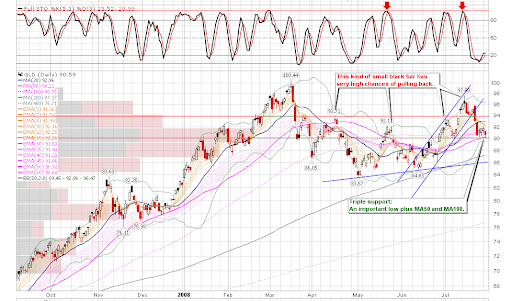
3.3.0 streetTRACKS Gold Trust Shares (GLD Daily).  The triple support is now broken, as I predicted in the weekend report.

Conclusion: the probability of pullback tomorrow or the day after tomorrow is high.  The market will be very unlikely to go up the second day after tomorrow.  I keep skeptical to how long the rally will last, but I will go long by following NYSI signal anyway.  By skeptical I mean when the market is extremely overbought, it is wise to make short-term counter-trend short.  Please keep a eye on the short-term signals on 0.0.1 Simple SPY Trading System.

Wednesday, July 30, 2008

07/29/2008 Market Recap: No much room left on the upside

Today the market soared, and bulls are quite excited.  Well, it is probably a bit over-bullish since two key indicators are very close to reversal region, so I doubt the further upside room.  My gut feeling is that the July 15 market bottom might not be very mature due to the external intervention, as a result several key indicators frequently get overbought and the market may keep range bounding to test if you have a brave heart.

Anyway, the NYSI mid-term buy signal on 0.0.1 Simple SPY Trading System is to be followed.  Reversal candle as well as heavier volume, so today one should partially buy in.  There is no 100% accurate trading signals, the key to success is persistence and following the probability over the long term.

Why do I doubt the rally?  Here are the reasons.

1.1.B QQQQ and VXN.  Note the NAMO is near overbought.  If the market continues to go up, ... you know what will happen.

1

0.0.2 Market Top/Bottom Watch.  Maybe it is more obvious on 2.8.1 CBOE Options Total Put/Call Ratio, but 0.0.2 is a big picture.  Again, CPC is merely 0.84, which is close to well-known market top value 0.8.  Note the red dashed lines, when MA(10) went below MA(200) that much, very often the market dived down.  Therefore be alerted to this indicator.

2

3.1.0 US Dollar Index (Daily).  Today the US Dollar was quite bullish.  Tomorrow it will be challenged, however.

3

3.2.0 Japanese Yen (Daily).  The Japanese Yen is sitting on a very important support.  How important is the support?  You may get it on the weekly chart 3.2.1 Japanese Yen (Weekly).

4

3.3.0 streetTRACKS Gold Trust Shares (GLD Daily).  GLD is on the triple support.

5

3.4.3 United States Oil Fund, LP (USO 60 min).  It is still Bullish Falling Wedge, and both MACD and RSI show positive divergence.

6

As a summary to the inter-market conditions, tomorrow is the key.  The rally of Yen and oil, if any, will be bearish to the stock market.

1.1.A PowerShares QQQ Trust (QQQQ 15 min).  It looks like a Flag so at least tomorrow morning it may go further up.

7

1.2.7 Diamonds (DIA 15 min).  Here is a Bearish Rising Wedge.  RSI doesn't look good.

8

1.3.6 Russell 2000 iShares (IWM 15 min).  Bearish Rising Wedge.

9

1.4.0 S&P/TSX Composite Index (Daily).  The Canada market looks like a Descending Triangle pattern.  Be cautious, it may break downward.

10

1.4.3 S&P/TSX Composite Index (15 min).  On the 15-min chart the pattern is Bearish Rising Wedge, too.

11

Tuesday, July 29, 2008

07/28/2008 Market Recap: No Title

Recently there is a pattern that if one day the market plunges, it probably will not plunge again in the second day.  You may verify this on a daily chart of any index (note: it is index, not ETF), in fact the market rarely sells off for two consecutive days.  If this pattern is still valid, tomorrow we may see a rebound.  Both SPX and INDU are oversold, but Breadth is not although it is not far away from oversold region.

The Russell 3000 Dominant Price-Volume Relationships are 1429 stocks price down volume down, 1012 stocks price down volume up.  This means the overall market is actually not oversold yet.

0.0.1 Simple SPY Trading System.  STO is oversold, and SPY is pulled back to Fib 61.8.  According to the trading rules, long positions should not be initiated today because there is no reversal candle.  Note the RHNYA and NYA50R are close to oversold region, this means it is probably fine to try a little bit of long positions providing that the market goes down tomorrow.

1

1.2.0 Dow Jones Industrial Average (Daily).  Note that STO is at a very low level, and tomorrow $INDU has a high possibility of bouncing up.

2

1.1.C TRINQ Trading Setup.  Tomorrow QQQQ will likely go up since TRINQ closed above 2.0.

3

Sunday, July 27, 2008

07/25/2008 Market Recap: Market still needs a pullback especially Nasdaq

1.1.B QQQQ and VXN.  Based on the NAMO indicator COMPQ is overbought.  VXN has not gone out of the oversold region, and it actually looks like a double bottom which also formed in the begining of April.  So I don't think QQQQ has a tradable upside space.

1

Concerning the broad market $SPX, the CPC at the bottom of 2.8.0 CBOE Options Equity Put/Call Ratio is 0.83 at the Friday market close, which is quite close to widely-used market top value 0.8.  In other words, the market is too bullish, not bearish, and I don't think $SPX will start a big rally from this point.

2

3.1.0 US Dollar Index (Daily)Spinning Top and then Doji.  I don't consider it as a consolidation pattern, maybe it's likely a reversal one considered that STO has reversed after meeting the resistance line.

3

On the weekly chart 3.1.1 US Dollar Index (Weekly) apparently the Bear Flag has broken downward, and now it's testing back the breakout point.  RSI on the top of chart seems unable to penetrate 50, which is a typical sign of USD bear market.  USD seems getting resistance and having reversed downward at 74.31.  The overall picture is breakdown, bounce back, breakdown, bounce back, now breakdown again, and got lower low.  So USD is bearish.

4

3.4.3 United States Oil Fund, LP (USO 60 min).  On the chart USO seems being ready to fight back.  Note the Bullish Rising Wedge as well as the positive divergence of MACD and RSI indicators.

5

5.3.0 Financials Select Sector SPDR (XLF Daily) is bulls' big hope, however the volume is shrinking during three days of dropping, which is a continuation pattern of the downtrend.  Note that price down volume down is not bullish, as I said before.  If one day the volume spikes as the price goes down, that will be a sign of trend reversal.  If you remember in my Thursday report I said Canada market 1.4.0 S&P/TSX Composite Index (Daily) would bounce back.  The reason is that the volume kept increasing.  Again, all I said is a matter of probability, and there are exceptions.  Anyway, these volume patterns are fairly popular.

6

7

0.0.1 Simple SPY Trading System.  VIX is a bit low and might go out of MA(10) Envelop.  NYADV on the other hand is a bit high and might go oversold.  Therefore I don't think short-term short is risky.  My target is still Fib 50.

8

On 1.0.7 S&P 500 SPDRs (SPY 15 min) you can see that the target of the Descending Triangle is about 124.

9

On 1.0.5 S&P 500 SPDRs (SPY 60 min) we cannot rule out the possibility of Head and Shoulders Top.

10

1.0.2 S&P 500 Large Cap Index (Monthly).  July will be over after four trading days.  In the bear market -- hopefully no one has different opinion -- the drop of SPX always lasted more than one month.  Therefore the candle of July is most likely another red bar.

11

1.1.A PowerShares QQQ Trust (QQQQ 15 min).  Bearish Rising Wedge.

1.2.7 Diamonds (DIA 15 min).  Descending Triangle.

1.3.6 Russell 2000 iShares (IWM 15 min).  Descending Triangle.

3.3.2 streetTRACKS Gold Trust Shares (GLD 60 min).  Isn't it a Bearish Rising Wedge?  A Head and Shoulders Top seems forming.  I am not sure if the gold will rally significantly but it looks like a merely technical rebound considered that the volume Friday slipped down when the price went up on the daily chart 3.3.0 streetTRACKS Gold Trust Shares (GLD Daily).

12

By the way, on 1.3.7 Russell 3000 Dominant Price-Volume Relationships  1293 stocks were price up volume down on Friday.  You may read from the chart that the pattern of recent rallies are mostly price up volume down.  In my opinion, this is bearish.

The conclusion is that the pullback is not over yet, and the excuse of further pullback might be the bounce back of commodity.  Whether it will be bullish or bearish after the pullback, at the moment I tend to long and hold it to next overbought after this pullback gets oversold.  If the market goes up without pullback first, it won't reach too high because it may be overbought easily.  Therefore you can think about to short if the market goes up.

Friday, July 25, 2008

07/24/2008 Market Recap: Evening Star

Okay, the market finally pulled back, and those overbought signals what I was buzzing for two days have also gone neutral.  So what will the market do tomorrow, no idea.  However, three major indices all showed Evening Star which is bearish, and this candle is so accurate that the confirmation tomorrow is nearly unnecessary.  Furthermore, the US dollars may also pullback.  As a consequence of all these factors, the pullback is likely continued.

0.0.1 Simple SPY Trading System.  As I said yesterday, Bearish Shooting Star and if the market pulled back today this candle got confirmed.  Therefore you should have take the short-term short.

On the 15-min intraday chart, there were three nearly perfect chances for day trading (DT).  The breakout of Open Range at about 11AM was the best setup today, because there were three inside bar prior to the breakout which has a high probability of success among DT Base and Breakout Setups.  An inside bar likes a string which accumulates energy, once it breaks out it is going to be violent, and this is why trading the inside bar breakout is likely more successful.

1

Afterward there were two times of consolidation.  However bears should feel pretty safe because TRIN on 2.1.2 NYSE - Tick (5 min) stayed above 1.2 all the time, and more importantly $XJY was rising the whole day.  So you have no reason to fear the trend reversal.

2

When the market was about to close, you might lock profit, or keep your positions because the Evening Star on the daily chart has a higher chance of further down.  The downside target is at Fib 50, about 124.48.

3

On the other hand, swing traders don't need to concern the open range breakout.  Once the yesterday low was broken, they should feel safe to short.

1.1.0 Nasdaq Composite (Daily).  It's an Evening Star.  The target is likely Fib 50 at 2250.  But on 0.0.8 TRINQ Trading Setup TRINQ is over 2.0 today, which means QQQQ may go up tomorrow.  I don't know which one is more likely.  Possibly tomorrow is a small rally since Evening Star doesn't mean the next day will be down for sure, it can mean the trend in the next few days is downward.

4

1.2.0 Dow Jones Industrial Average (Daily).  Evening Star.  The possible target is Fib 50 at 11261.

1.4.0 S&P/TSX Composite Index (Daily).  The Canada market has plunged for three days and the volume was increasing, which look a bit like capitulation.  So I think it may bounce back.

1.5.0 Shanghai Stock Exchange Composite Index (Daily).  It looks bullish, and possibly a Head and Shoulders Bottom.  Of course, the pattern isn't valid before the neckline is broken.

1.6.0 Hong Kong Hang Seng (Daily).  Note the resistance on STO and RSI(14) indicators.

3.0.0 10Y T-Bill Yield.  It is a Bearish Abandon Baby and will possibly go down for a while.  This is very important because its downside movement means the money flows to the bond market, so it is bearish to the stock market.  Its down also indicates the demand for the US treasury bill is weak which will cause the depreciate of US dollars, which will in turn cause the appreciation of Japanese Yen.  As a result the Carry Trade unwinds, and this is bearish to the stock market.

5

3.1.0 US Dollar Index (Daily).  It's a Spinning Top, so the trend may reverse.  In addition note the resistance on the STO, so it may go down.

3.2.3 US Dollar/Japanese Yen Ratio.  If the USD goes down, watch this chart.  If it cannot pass the resistance, the Carry Trade will unwind and the market may go down as well.

6

Thursday, July 24, 2008

07/23/2008 Market Recap: Overbought Overbought

Market is overbought and due for pullback.  My trading rule is that, as I said before, no taking new long positions when the market is overbought.  If the market keeps going up and overbought, I watch.  Again, this is a matter of probability, and I do not take chance of the low probability of that the market could be overbought and deeper overbought.  If you wonder why the market didn't bounce back when it kept oversold a few days ago, you may read the chart 1.0.0 S&P 500 Large Cap Index (Daily) and notice that the market haven't gone down for three consecutive down days except for those three days just prior to the big V-turn.  On the other hand, so far we have seen six up days on 0.0.1 Simple SPY Trading System.  Well, there is no market in this world which goes up only and never pulls back.

0.0.1 Simple SPY Trading System.  Today it is a Bearish Shooting Star pattern, considering those overbought signals, the setup is a possible short-term short.  If we do not see a red candle to confirm the setup, we'd better wait.  Note the NYSI signal of mid-term long, as I said yesterday, it is your decision to initiate the long position in the morning or wait for the pullback like me.  I have had long positions for hedging, so I do not rush besides aforementioned reason (no new long when overbought).

1

1.3.0 Russell 2000 iShares (IWM Daily).  It has gone up for six consecutive days and retraced to Fib 61.8.  MA(200) is being tested at the moment.

2

2.2.1 NYSE McClellan Oscillator.  Another overbought signal today, and the position is pretty high.

3

3.4.1 United States Oil Fund, LP (USO Daily).  The oil has retraced to Fib 38.2.  At the moment it is unclear where the target is.

4

5.3.0 Financials Select Sector SPDR (XLF Daily).  It failed to test MA(50) line and formed a reversal candle.  Within such a short period of six days, it has reclaimed the loss in the past two months.  How amazing it is!

5

Wednesday, July 23, 2008

07/22/2008 Market Recap: Market Overbought

Today based on 0.0.1 Simple SPY Trading System the plan was short-term short.  Someone asked me yesterday, what should we do if the market gapped down today?  My answer was to wait for the gap being filled at about 10:30am, then watch 2.1.2 NYSE - Tick (5 min) and see if TRIN stayed above 1.2, at the same time $XJY should go up.  However today TRIN was quite bearish all the time, and $XJY kept falling.  This was against the short signal until the market closed, and a huge Bullish Engulf pattern was formed.  Therefore the sell signal was not confirmed today, and we have to wait for the next chance.  Concerning the $XJY confirmation, I find that the market will normally close in green if $XJY goes down.  This phenomena is valid recently but may not hold forever.

1

Today we got mid-term buy signal.  On 0.0.0 Signal Watch and Daily Highlights needed mid-term signals on the left side of the chart are all in green, including my favorite signal 2.2.0 NYSE McClellan Chart.

2

As a result of this, 0.0.1 Simple SPY Trading System says it's time to close mid-term short, and open mid-term long.  However there are some overbought signals on the chart which means the market is due for pullback.  So you have to make a decision whether to close mid-term short and open mid-term long after a pullback OR close short / open long tomorrow morning.  For myself, I do not open long positions when the market is overbought.  All signals are about probability, TA is not 100% accurate, but the spirit of TA is to bet the high probability setups, not worry about "this time may be different".  When I say the market is due for pullback in the near term, I mean the market has a higher probability of pullback than rally.  Whenever you believe this time is different and the signals might be wrong, please feel free to go ahead.

3

1.0.0 S&P 500 Large Cap Index (Daily).  Similar with other indices, it is overbought but MACD is confirmed buy signal.  Also note the all black buy signal on the bottom of the chart.

4

1.1.0 Nasdaq Composite (Daily).  It is testing the downtrend line.

1.1.6 PowerShares QQQ Trust (QQQQ Daily).  It is funny that VXN MA(10) Envelope is oversold.  What does this mean?  fall further down?  At least the upside space is not much.

5

1.2.1 Dow Jones Industrial Average (Weekly).  $INDU is testing back the trendline, which so called kill channel goodbye.

6

1.2.7 Diamonds (DIA 15 min).  The negative divergence of RSI is obvious on the 15-min intraday chart.  But take the notice that the divergence does not mean immediate pullback, it usually has to be confirmed by other signals.

2.0.0 Volatility Index - NYSE (Daily).  It is extremely oversold.  Note that the breakout of MA(10) Envelop is the greatest since the beginning of this year.  The probability of the market pullback is very high.

7

2.4.2 NYSE - Issues Advancing.  Overbought on the chart also means pullback.  Note that the portion it extends into the overbought region is the greatest in the year, and overbought/oversold of this signal has been fairly accurate in the past.  (this time might be an exception, who knows?)

8

3.3.0 streetTRACKS Gold Trust Shares (GLD Daily).  It broke the support, so I closed my position.

3.4.3 United States Oil Fund, LP (USO 60 min).  MACD and RSI have a little bit positive divergence.

5.3.0 Financials Select Sector SPDR (XLF Daily).  It is right on the Fib 50 line at where the pullback usually finishes.  Tomorrow MA(50) will be tested, which is very important.

9

Disclaimer

The information contained on this website and from any communication related to the author’s blog and chartbook is for information purposes only. The chart analysis and the market recap do not hold out as providing any financial, legal, investment, or other advice. In addition, no suggestion or advice is offered regarding the nature, profitability, suitability, sustainability of any particular trading practice or investment strategy. The materials on this website do not constitute offer or advice and you should not rely on the information here to make or refrain from making any decision or take or refrain from taking any action. It is up to the visitors to make their own decisions, or to consult with a registered professional financial advisor.

This websites provides third-party websites for your convenience but the author does not endorse, approve, or certify the information on other websites, nor does the author take responsibility for a part or all materials on the third-party websites which are not maintained by the author.