Live Update

Saturday, April 30, 2011

04/29/2011 Market Outlook (A Reliable Top Signal)

SHORT-TERM: EXPECT SOME WEAKNESS AHEAD

Three cents:

  1. Still expect a pullback, but it’s difficult to time now. One thing I’m relatively sure is, pullback or not, we should see more new highs anyway.
  2. Cannot exclude the possibilities that the market was topped (or very close) (either short-term or intermediate-term top).
  3. Trading wise, before seeing a sharp sell off, the name of the game still is to buy dips.

Why should we see more new highs ahead? Because, the RSI in chart 1.0.0 S&P 500 SPDRs (SPY 60 min) shows very strong up momentum so should be more new highs ahead until a clear RSI negative divergence is formed. Trading wise, accordingly, the very first dip is buy. Why? Because only after a pullback, the price makes a new high while RSI cannot make a new high then a negative divergence can be formed. Then why is a negative divergence needed? It’s the law of inertia. A forward accelerating car cannot be simply reversed without reducing the forward speed first. The process of reducing the speed is equivalent to negative divergence.

SPY60min

In 04/27 Market Outlook and 04/28 Market Outlook, my major reasons for calling a pullback is SPX closed above BB for 2 to 3 days in a row which had very good chances of leading to a pullback since year 2003. Unfortunately (or fortunately) SPX closed above BB top again on 04/29 which had only one occasion since 2003, therefore the argument is no longer reliable anymore. (By the way, there’re 10 cases since 1991 that SPX closed above BB top for 4 days in a row, there’s no apparent short-term bearish edges. I generally don’t read such a long history anyway) This is why I said, although I still expect a pullback but cannot time it anymore.

Listed below are the reasons why I’m still looking forward to a pullback.

T2112, keeps rising. Everyone knows such a rising will be reversed someday so if only I keep yelling for a pullback, I’d be right one day. But this does not help in trading at all so this is why I don’t wan to time the pullback anymore. Should be sooner than later, that’s all I can say.

T2112

T2122, as I mentioned before, this is my ultimate weapon for monitoring overbought/oversold. Now it’s very close to the “recent” extremes.

T2122

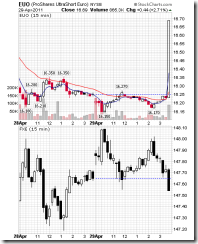
Dollar down 8 days in a row plus volume surge and too stretched below MA(200), so we should see a short-term rebound soon. The statistics below is from Bespoke. Although the original purpose of Bespoke is to say that in the intermediate-term the dollar is bearish, but it also clearly says that there’ll be a rebound in the short-term. The rebound of the dollar would mean a pullback of the stock market. Besides, interestingly, take a look at what happened on EUO before the Friday close although the correspondent FXE didn’t drop much. Euro weights almost 75% in the dollar index, so if EUO didn’t lie than Euro should drop sharply the next week which in turn means a sharp rebound of the dollar.

UUPDaily
USDWeekly
USDPerformanceAfter9ConsecutiveDownDays
EUO15min

Why cannot I exclude the possibilities that the market was topped? Because 0.2.4 Nasdaq Total Volume/NYSE Total Volume surged to a new high which is a very reliable top signal. Combining with the SPY ST Model top signal mentioned in the 04/28  Trading Signals, there’s a chance that the market was topped, although any top calling looks ridiculous now and it conflicts with the RSI negative divergence mentioned above.

NATVtoNYTVRatio

The chart below is the NORMALIZED Nasdaq Total Volume / NYSE Total Volume Ratio. Also argues for a top.

NormalizedNATVtoNYTVRatio

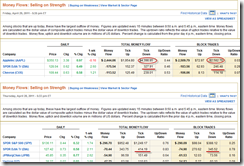
I’m not confident about such a top calling for now although I believe a short-term pullback is due. The Friday’s money flow is very interesting. AAPL Block Sell to Total Sell ratio is 2582 / 4398 = 59%. Either it’s because of QQQ rebalancing or those big buys knew something terrible is about to happen. And it also could be the reason that Nasdaq Total Volume / NYSE Total Volume Ratio surged, which is why I’m not confident about the top calling. By the way, INDU is very strong those days, but interestingly, for 2 days in a row DIA had a very high Block Sell to Total Sell ratio, 246 / 327 = 75%, 345 / 414 = 83%, something suspicious is going on.

MoneyFlow

Anyway, top or not, let’s watch the CPCE trend line the next week. Breakout and hold then we’d have 2 reliable top signals and that would be something worth serious attention.

CPCE

INTERMEDIATE-TERM: SPX NOW IN 1352 TO 1381 WAVE 5 PRICE TARGET AREA, WATCH FOR POTENTIAL REVERSAL

See 04/27 Market Outlook for more details.

SEASONALITY: BULLISH MONDAY AND FRIDAY

According to Stock Trader’s Almanac:

  1. First trading day in May, Dow up 10 of last 12.
  2. Friday before Mother’s day, Dow up 10 of last 15.

The following May seasonality statistics is from Bespoke.

MaySeasonality

The following May seasonality chart is from Sentimentrader.

MaySeasonalityDayByDay

ACTIVE BULLISH OUTLOOKS:

ACTIVE BEARISH OUTLOOKS:

HIGHLIGHTS OF THE OTHER ETFS IN MY PUBLIC CHART LIST: 

TREND CANDLESTICK COMMENT
QQQ & Weekly UP Doji 
IWM & Weekly UP Spinning Top  ChiOsc is way too high.
SSEC & Weekly *DOWN *Officially in downtrend now, be careful.
EEM & Weekly UP Doji 
XIU & Weekly DOWN *1.5.1 XIU.TO 60 min: Ascending Triangle?
TLT & Weekly UP
FXE & Weekly UP 3.1.1 US Dollar Index Bullish Fund: Volume surge, bottomed?
*FXE is now too high above MA(200), see weekly chart.
GLD & Weekly UP *ChiOsc is way too high.
GDX & Weekly UP
USO & Weekly UP  
XLE & Weekly UP
XLF & Weekly *UP Hanging Man Bear Flag?
IYR & Weekly UP Hanging Man 
XLB & Weekly UP Doji
  • * = New update; Blue Text = Link to a chart in my public chart list.
  • UP = Intermediate-term uptrend. Set when weekly buy signal is triggered.
  • DOWN = Intermediate-term downtrend. Set when weekly sell signal is triggered.

Friday, April 29, 2011

04/29/2011 Trading Signals

THE BOTTOM LINE, THE SHORT-TERM TREND IS UP, I HOLD LONG POSITION OVERNIGHT.

I’m bearish biased toward the short-term, not necessarily the next Monday though (kind hope a big up Monday to let me adjust my position, LOL). I’ll, as usual, try to coax you into believing so in the weekend report.

Seasonality is mixed for the next Monday. Generally, we should have a very very bullish 1st trading day of the Month but on the other hand the recent Mondays mostly were in red.

12

If you followed the Cobra Impulse System yesterday, it’s time to set your stop loss to breakeven now. May cause a premature exit but since the top warning issued by SPY ST Model is still valid today so better safe than sorry.

3

As for the price volume negative divergence trade mentioned yesterday, yes, it’s still valid. And now we have price up 4 days in a row while volume down 3 days in a row which is even more extreme. An up Monday with increased volume would make it a much better short setup. We’ll see.

4

Enjoy your weekend!

MECHANICAL TRADING SIGNALS: 

TREND MOMENTUM COMMENT
Long-term 2 of 2 BUY
Intermediate 4 of 5 BUY 5 of 5 NEUTRAL Cobra Impulse in BUY mode; Non-Stop in BUY mode.
Short-term 5 of 6 NEUTRAL
SPY SYSTEM ENTRY STOP LOSS INSTRUCTION: back test is HERE, signals are HERE.
Non-Stop 04/28 L N/A
CI Buy & Hold 04/28 L N/A
CI Swing 04/28 L *Breakeven *Adjust the stop loss.

DEMO ACCOUNT FOR SHORT-TERM MODEL:

TICKER Entry Date Entry Share Stop Loss Exit Date Exit Profit Comment
SSO 04/29/2011 $56.25 100 $54.73 04/29/2011 $56.32 8.00  
SSO 04/27/2011 $55.22 100 $53.69 04/27/2011 $55.70 48.00  
SSO 04/25/2011 $53.99 100 $52.02 04/25/2011 $54.07 8.00  
SSO 04/20/2011 $53.62 100 *$54.73 New strategy, always hold.
SDS 04/19/2011 $21.54 200 $20.95 04/20/2011 $20.72 -174.00  
SDS 04/14/2011 $21.24 100 $20.95 04/20/2011 $20.72 -52.00  
SDS 04/13/2011 $21.19 300 $20.62 04/18/2011 $21.54 105.00  
SDS 04/12/2011 $21.30 200 $20.45 04/13/2011 $21.40 20.00  
SSO 04/11/2011 $53.16 100 $51.38 04/18/2011 $51.37 -179.00  
SDS 04/11/2011 $20.93 200 $20.45 04/12/2011 $21.34 82.00  
SSO 04/08/2011 $53.47 100 $51.57 04/11/2011 $53.58 11.00  
SDS 04/07/2011 $20.71 400 $20.46 04/08/2011 $20.86 60.00 1st short, half positioned.
SSO 04/07/2011 $54.35 100 $53.09 04/08/2011 $54.36 1.00  
SSO 04/06/2011 $53.93 200 $53.09 04/06/2011 $54.13 40.00  
SSO 04/04/2011 $53.74 100 $53.09 04/08/2011 $54.00 26.00  
SSO 04/01/2011 $54.00 100 $51.57 04/05/2011 $54.18 18.00  
SSO 03/28/2011 $52.02 100 $49.91 04/01/2011 $54.09 207.00  
LAST 1158.00  
SUM 1387.00  
  • $200 max loss allowed per trade. For fun only.
  • LAST = Year to the last month balance.

04/29/2011 Intraday Comment Thread

http://bbs.cobrasmarketview.com/viewtopic.php?f=2&t=145

Thursday, April 28, 2011

04/28/2011 Market Outlook: Still expect some weakness ahead

SHORT-TERM: EXPECT PULLBACK AS EARLY AS TOMORROW

Three cents:

  1. Still expect a pullback, as early as tomorrow.
  2. Today’s Trading Signals is very important, please take a look because it mentioned that SPY ST Model is yelling for a top now. The model has very good credit for calling a top in the past, so although sounds stupid to call a top now but let’s just don’t neglect it.
  3. Trading wise, as long as it’s not a sharp pullback, it’s a buy opportunity.

The arguments for the pullback are mostly the same as those mentioned in 04/27 Market Outlook, just some are even more extreme.

SPX closes out of BB top for 3 consecutive days, short at today’s close and cover tomorrow (if SPX closes below BB top), you’ll have 90% chances since year 2003. Remember I said in today’s Trading Signals that short at the close may not be the best entry? Well, the chart below also explains why as 100% chances we’ll see a higher high tomorrow.

SPXCloseOutOfBBFor3Days

T2112 becomes more extreme.

T2122

The 3rd reason is for fun only. Have you noticed that the recent patterns are up 3 days then down 1 day? LOL

SPYShortTerm

There’re some other bearish signals, not necessarily mean a pullback tomorrow, but are by no means bull friendly in the short-term.

OEX Put/Call Ratio surge again.

OEXPutCallRatio

Rydex Traders (we retailers) are way too bullish now.

RydexBetaChaseIndex
RydexBullBearRSISpread

INTERMEDIATE-TERM: SPX NOW IN 1352 TO 1381 WAVE 5 PRICE TARGET AREA, WATCH FOR POTENTIAL REVERSAL

See 04/27 Market Outlook for more details.

SEASONALITY: BEARISH MONDAY, THURSDAY AND FRIDAY, BULLISH WEDNESDAY

See 04/21 Market Recap for more details.

ACTIVE BULLISH OUTLOOKS:

ACTIVE BEARISH OUTLOOKS:

HIGHLIGHTS OF THE OTHER ETFS IN MY PUBLIC CHART LIST: 

TREND CANDLESTICK COMMENT
QQQ & Weekly UP Bearish Harami
IWM & Weekly UP *ChiOsc is way too high.
SSEC & Weekly UP More weakness would mean downtrend, be careful.
EEM & Weekly UP Doji 
XIU & Weekly DOWN May see further pullback.
TLT & Weekly UP
FXE & Weekly UP Spinning Top *3.1.1 US Dollar Index Bullish Fund: Volume surge, bottomed?
GLD & Weekly UP *ChiOsc is a little high.
GDX & Weekly UP Shooting Star
USO & Weekly UP Doji 
XLE & Weekly UP Hollow Red Bar
XLF & Weekly DOWN Bear Flag?
IYR & Weekly UP
XLB & Weekly UP Doji
  • * = New update; Blue Text = Link to a chart in my public chart list.
  • UP = Intermediate-term uptrend. Set when weekly buy signal is triggered.
  • DOWN = Intermediate-term downtrend. Set when weekly sell signal is triggered.

04/28/2011 Trading Signals

THE BOTTOM LINE, THE SHORT-TERM TREND IS UP, I HOLD LONG POSITION OVERNIGHT.

I’m bearish biased toward tomorrow which as usual, I’ll present my witnesses in tonight’s report. If you want to be a very short-term bear, shorting right now in AH may not be a good idea because statistically at least there’ll be a price that is higher than today’s close some time tomorrow which means you should be able to get a better entry if you short tomorrow. Just beware, trading against the trend is always dangerous no matter how statistics says.

I see one very short-term short setup today: SPY up 3 days in a row but volume down 2 days in a row (so called price volume negative divergence), short at today’s close, surprisingly the winning rate WAS not bad, although I really hate this setup.

1

Cobra Impulse System is now officially in buy mode. The long setup HAD 80% winning rate. So hopefully it could be right this time.

3

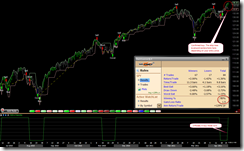
There’s one warning I’d like you to know about the Cobra Impulse System’s long position though: If you still remember the SPY ST Model, which has a very good way of detecting a market top but unfortunately I haven’t got the time to test whether the top detecting algorithm could be used in Cobra Impulse System yet. For now I just want you to know that SPY ST Model is yelling for a top of some kind and therefore asking for tightening the stop loss. The 2nd chart below shows clearly how the top detecting algorithm worked in the past which was pretty amazing. I’ll integrate this top detecting algorithm into the Cobra Impulse System, if it turns out to be correct again this time.

2
4

MECHANICAL TRADING SIGNALS: 

TREND MOMENTUM COMMENT
Long-term 2 of 2 BUY
Intermediate 4 of 5 BUY 5 of 5 NEUTRAL Cobra Impulse in *BUY mode; Non-Stop in BUY mode.
Short-term 5 of 6 NEUTRAL
SPY SYSTEM ENTRY STOP LOSS INSTRUCTION: back test is HERE, signals are HERE.
Non-Stop *04/28 L N/A *Long position initiated on 04/28.
CI Buy & Hold *04/28 L N/A *Long position initiated on 04/28.
CI Swing *04/28 L *1.7*ATR(10) *Long position initiated on 04/28.

DEMO ACCOUNT FOR SHORT-TERM MODEL:

TICKER Entry Date Entry Share Stop Loss Exit Date Exit Profit Comment
SSO 04/27/2011 $55.22 100 $53.69 04/27/2011 $55.70 48.00  
SSO 04/25/2011 $53.99 100 $52.02 04/25/2011 $54.07 8.00  
SSO 04/20/2011 $53.62 100 $53.69 New strategy, always hold.
SDS 04/19/2011 $21.54 200 $20.95 04/20/2011 $20.72 -174.00  
SDS 04/14/2011 $21.24 100 $20.95 04/20/2011 $20.72 -52.00  
SDS 04/13/2011 $21.19 300 $20.62 04/18/2011 $21.54 105.00  
SDS 04/12/2011 $21.30 200 $20.45 04/13/2011 $21.40 20.00  
SSO 04/11/2011 $53.16 100 $51.38 04/18/2011 $51.37 -179.00  
SDS 04/11/2011 $20.93 200 $20.45 04/12/2011 $21.34 82.00  
SSO 04/08/2011 $53.47 100 $51.57 04/11/2011 $53.58 11.00  
SDS 04/07/2011 $20.71 400 $20.46 04/08/2011 $20.86 60.00 1st short, half positioned.
SSO 04/07/2011 $54.35 100 $53.09 04/08/2011 $54.36 1.00  
SSO 04/06/2011 $53.93 200 $53.09 04/06/2011 $54.13 40.00  
SSO 04/04/2011 $53.74 100 $53.09 04/08/2011 $54.00 26.00  
SSO 04/01/2011 $54.00 100 $51.57 04/05/2011 $54.18 18.00  
SSO 03/28/2011 $52.02 100 $49.91 04/01/2011 $54.09 207.00  
LAST 1158.00  
SUM 1379.00  
  • $200 max loss allowed per trade. For fun only.
  • LAST = Year to the last month balance.

Disclaimer

The information contained on this website and from any communication related to the author’s blog and chartbook is for information purposes only. The chart analysis and the market recap do not hold out as providing any financial, legal, investment, or other advice. In addition, no suggestion or advice is offered regarding the nature, profitability, suitability, sustainability of any particular trading practice or investment strategy. The materials on this website do not constitute offer or advice and you should not rely on the information here to make or refrain from making any decision or take or refrain from taking any action. It is up to the visitors to make their own decisions, or to consult with a registered professional financial advisor.

This websites provides third-party websites for your convenience but the author does not endorse, approve, or certify the information on other websites, nor does the author take responsibility for a part or all materials on the third-party websites which are not maintained by the author.