Live Update

Tuesday, March 31, 2009

03/31/2009 Market Recap: N vs N Rule

Not much to say today, check the chart below, hopefully according to “n vs n rule” the market could give us a clear direction tomorrow.

NvsN

1.0.3 S&P 500 SPDRs (SPY 30 min), STO has just dropped from the overbought area, plus it’s the first time for the FAST MACD (black curve) to give buy signal which is most likely a whipsaw, therefore today could be just a rebound from the yesterday’s oversold condition, the market may drop again tomorrow.

SPY30min

1.1.6 PowerShares QQQ Trust (QQQQ 15 min), ChiOsc is way too low, so QQQQ might rebound tomorrow morning. 1.0.4 S&P 500 SPDRs (SPY 15 min) and 1.3.3 Russell 2000 iShares (IWM 15 min) both have the similar problem with ChiOsc, just they are not very extreme.

QQQQ15min

Monday, March 30, 2009

03/30/2009 Market Recap: The uptrend is in jeopardy

The breakdown of SPX 791 today means that for 2 down days bears have completely recovered the previous 2 up days, therefore 2 vs 2 bears won. This is to say that it’s very likely that the uptrend has now reversed. Bulls still have hopes though. See the following chart, if by Wednesday, the low of the SPX is higher than 766, then the uptrend is still valid. Nevertheless, the bigger picture, because now it’s almost impossible for bulls to push SPX above 875 within 2 days, therefore 18 vs 18, the strength of the rebound is weaker than the strength of sell off, this means we are still in the bear market while the primary trend is still pointing down.  For people who are new to the n vs n rule, please refer to 7.2.1 Buyable Pullback Rule and verify the effectiveness of this rule for pinpointing the trend change.  In fact, this is very similar with the preliminary Dow theory for checking the trend based on higher high and lower low, while in my way the time is factored in.

image

2.4.2 NYSE - Issues Advancing.  Lower low on this chart means that SPX should at least have a lower close ahead than today’s close at 787.

image

1.0.5 Major Accumulation/Distribution Days.  Today is a major distribution day, which means the market may not have any decent rebound before making another major distribution day providing that there is no major accumulation day in the near term.

image

0.0.3 SPX Intermediate-term Trading Signal, 1.1.4 Nasdaq 100 Index Intermediate-term Trading Signals.  STO is still overbought regardless of two down days in a row.

image

1.3.7 Russell 3000 Dominant Price-Volume Relationships.  Some people claim that recent down accompanies with lower volume and thus should be deemed as bullish.  Well, in the bear market price down volume down is actually a continuation pattern which is surely not bullish.  Anyway, 1389 stocks price down volume up today in Russell 3000, and this is not lower volume at all.

image

As what you can see, the market condition does not favor bulls for now, however hopefully the market could bounce back up in the very short term.

1.0.2 S&P 500 SPDRs (SPY 60 min).  STO is oversold, and the pattern also looks like a kiss back to the neck line of the head and shoulders pattern after the breakout.

image

1.0.4 S&P 500 SPDRs (SPY 15 min).  Quite a few positive divergence so a rebound is hopeful.

image

Sunday, March 29, 2009

03/27/2009 Market Recap: The truth within 3 days?

The “Double Confirming Trendline” of 2.8.0 CBOE Options Equity Put/Call Ratio was broken on Friday, this means at least a short-term top has been reached. Like the other indicators, yes, we do need a follow-through to confirm, so today’s report will be about what more we need to see in order to confirm this indeed is a top.

CPCE


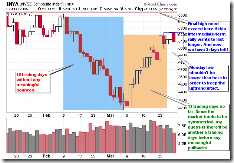
7.1.0 NYSE Composite Index Breadth Watch, the report here: 03/25/2009 Market Recap: 5 more days to go? made an assumption that this rally will go for 18 days without a meaningful pullback. Now 3 days left, I believe we’ll see the true nature of this rally within these 3 days.
NYADaily

  1. If SPX reaches a high which is higher than 875 then this means for the past 18 up days the SPX has completely recovered the previous 18 down days, therefore, 18 vs 18, bulls win, the intermediate-term rally is as real as it gets.
  2. If SPX low on Monday is lower than 791, then 2 up days vs 2 down days, bears win, confirming the top argued by 2.8.0 CBOE Options Equity Put/Call Ratio.
  3. If SPX low on Monday is higher than 791, then bulls win, therefore according to 7.2.1 Buyable Pullback Rule, theoretically the Monday’s dip should be treated as a buyable dip.

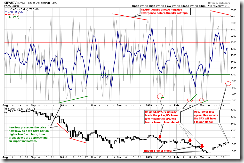
2.4.2 NYSE - Issues Advancing, NYADV formed a lower low on Friday which means, before the market reaching a higher high, there’ll be a lower close which should be lower than SPX 816. In other words, for the rest of 3 days of pushing up to SPX 875, there’ll be a down day. So, this down day better be the coming Monday, if Monday, say, closes at 815 (which is the minimum value that is lower than SPX Friday’s close at 816), then for Tuesday and Wednesday, the market has 2 days to push up to SPX 875. 875 – 815 = 60, 2 days for SPX to be up 60 points are still possible. But if the coming Monday is an up day, especially if the high couldn’t be higher than SPX 833, then SPX should drop to minimum 815 (unless, well, the past rule of 2.4.2 NYSE - Issues Advancing doesn’t work this time.), this way, on Wednesday, the SPX must rise more than 60 points to pass 875 which normally is very difficult.
NYADV

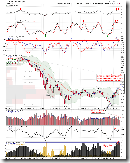
1.1.4 Nasdaq 100 Index Intermediate-term Trading Signals, still overbought intermediate-term, so there’s still a need for a short-term pullback.
NDXMidTerm

1.0.3 S&P 500 SPDRs (SPY 30 min), pay attention to the fast MACD at bottom (Black Curve), this is the 4th sell signal issued, well, maybe a whipsaw again, I’m not sure, the question here is, if there’s the 5th sell signal, how likely it will be a whipsaw again?

SPY30min

To summarize the above, SPX 791 is the key. If SPX drops bellow 791 on Monday, game is over for bulls. If SPX rises on Monday but the high is lower than 833, then it’s likely game over again for bulls (because SPX has to drop on Tuesday, see above analysis). If SPX drops on Monday but the low is higher than 791, then it’s likely game over for bears but SPX must be up more than 60 points within 2 days. So looks to me now, bears have a little up hand, after all, up 60 points for SPX within 2 days is a little bit difficult though not impossible.


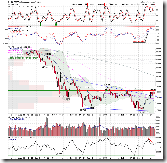
1.4.0 S&P/TSX Composite Index (Daily), Canada overbought.
TSXDaily

3.4.1 United States Oil Fund, LP (USO Daily), still looks like a Bearish Rising Wedge, if oil drops so might be the Canadian market.

USODaily

Thursday, March 26, 2009

03/26/2009 Market Recap: Beware of Rising CPC

Three points for your information.  The well expected meaningful pullback might be approaching, and it’s time for bulls to lock the profit and for bears to be patient.

  1. Note the normalized CPC at the bottom of 2.8.1 CBOE Options Total Put/Call Ratio is starting to rise.  Declining CPC has successfully predicted the recent rally, will the rising CPC forecast the pullback of the market?
    image
  2. 5.0.1 Select Sector SPDRs Financials sector has led the rally but it starts to lag behind.  Moreover, energy sector is also lagging behind.  The lag of these two sectors with the heaviest weights in the index may be a warning to the market.
    image
  3. 1.0.3 S&P 500 SPDRs (SPY 30 min).  The negative divergence becomes more serious which is sign of weakening momentum of this rally.  It is more clear to check the A/D for the negative divergence on ChiOsc, so I temporarily replaced ChiOsc with A/D.
    image

2.8.0 CBOE Options Equity Put/Call Ratio starts to test the double confirming trend line today.  The trend line is not broken yet.  However, it won’t be intact should the market drops down tomorrow.

image

As we talk about for several days, the market is more or less overbought in both short and intermediate term.  Let’s check out more details.

0.0.2 SPY Short-term Trading Signals.  RHNYA at the very bottom of the chart is 100%, which means there is no new 52 week low today.  Such a value can only be found in 2003 when the market had rallied for a while, while now the rally has only lasted for 14 days.

image

1.1.4 Nasdaq 100 Index Intermediate-term Trading Signals.  NDXA50R at the bottom of the chart is way too high which is at the big bull market level.  Note that NAADV and NAUPV starts to separate, and usually index starts to fall after NAUPV.  The separation between NYADV and NYUPV can also be seen on 0.0.3 SPX Intermediate-term Trading Signals.

image

T2122 from Telechart, 4 week New High/Low Ratio, is way too high.

image

Wednesday, March 25, 2009

03/25/2009 Market Recap: 5 more days to go?

Not much to talk about today.  In the short term the market is neutral, while the intermediate term it’s still overbought.  It seems the pullback would never happen, however I believe this situation won’t last for too long.  My wild guess is that, the market tends to walk symmetrically as what we’ve seen in nature very often.  Prior to this rally, there was no decent rebound during 18 trading days, so this rally may last 18 trading days as well without significant pullback.  Note that today is the 13th trading day, 5 more days to go?

image

Let’s check out how overbought the market is at this point of time.  The bottom line is whatever overbought shall be corrected by sell off sooner or later.

2.4.4 NYSE McClellan Oscillator.  Overbought, the overbought setup on McClellan Oscillator is fairly accurate.

image

T2122 from Telechart, 4 week New High/Low Ratio is still overbought.  This indicator is also quite accurate.

image

0.0.3 SPX Intermediate-term Trading Signals.  STO has reached a new high while NYADV and NYUPV are still overbought.

image

Tuesday, March 24, 2009

03/24/2009 Market Recap: Consolidation Day

A small candle following a big candle, this is a typical consolidation pattern, so today’s market actions say nothing about the future direction.  Short-term overbought signals have been corrected, so I have no idea about tomorrow.  CPC is below 0.8, tomorrow the market has 62.5% of chance to close in green according to 7.0.4 Extreme CPC Readings Watch.  However this chart has given false signals for three times, so I am not sure if it still works.  Over the intermediate term the market is still overbought, therefore a pullback is due in the short-term.  The bottom line is that the normalized CPC is too low on 2.8.0 CBOE Options Equity Put/Call Ratio, so I doubt how far this rally can go.  Today’s “down” is far from getting back the Monday’s “up”, should the market goes further down tomorrow without fully offsetting Monday’s gain, then I guess there’ll be a new high later.

CPCWatch


1.0.4 S&P 500 SPDRs (SPY 15 min).  The pattern can be seen as a kiss back after the breakout.  STO is a little bit oversold but not at an extreme level, therefore the market could bounce back up during the day if it drops further tomorrow.

image

3.4.1 United States Oil Fund, LP (USO Daily), possible Bearish Rising Wedge, plus STO overbought, so the crude oil may pull back.  3.4.2 United States Oil Fund, LP (USO 30 min), the bearish rising wedge can be clearly seen on the 30min chart.  The pullback of crude oil is bearish to the stock market.
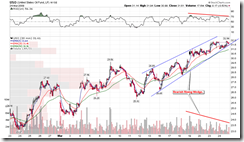
image  image

0.0.3 SPX Intermediate-term Trading Signals.  Note that the market is overbought over the intermediate term.

image

T2122 from Telechart, NYSE 4 week New High/Low ratio, overbought.  This indicator has been quite accurate once it gets overbought.

image

Seasonality, courtesy of www.sentimentrader.com. Just for fun. Tomorrow the Nasdaq 100 seems very bullish as statistically it has 70% chances of closing in green. However Friday looks terrible, will it be a black Friday?

image

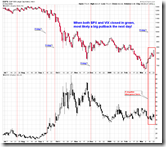
When both SPX and VIX drops

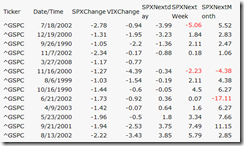
Just for your reference, today both SPX and VIX dropped. This is rare especially because SPX dropped more than 1%. The following table illustrates how the market performed in the past when SPX dropped more than 1% while VIX also dropped on the same day. The statistics were collected on March 27, 2008, so there’s no data shows after March 27, 2008, but we all know what happened after March 27, 2008. So, if history repeats itself, seems like the market performs well in the coming week as well as the coming month.

BothVIXandSPXDown

Today’s report will come soon… This is just a snack. :-)

Thank you for the referring!

I added three more blogs into my blogroll today. They've been providing good traffics to my blog recently so as a sign of sincere appreciation and to be fair, I've added them to my blogroll. Thank you guys! May the force be with you!

http://erikmarketview.blogspot.com/
http://kennystechnicalanalysisblog.blogspot.com/
http://shankystechblog.blogspot.com/

Monday, March 23, 2009

03/23/2009 Market Recap: Very Short-term Overbought

Now the market is very overbought in the very short term, and it may pull back in tomorrow morning.  Since CPC is lower than 0.8 again, 65% of the chance is to close in green according to 7.0.4 Extreme CPC Readings Watch.  Other short-term and intermediate-term signals are more or less overbought as well but not at extreme levels, so I am not sure if they will play out.  Based on the normalized CPC on 2.8.1 CBOE Options Total Put/Call Ratio, I still doubt the upside room of this rally.  On the other hand, in term of operation I will buy dip with no argument in order to hedge my short positions because the intermediate-term rally may last for a couple of days longer.

Take a look at two charts as follows which show why the intermediate-term rally could go further.

2.8.0 CBOE Options Equity Put/Call Ratio.  Finally we have a double confirming trend line.  However it may take some time should CPCE decisively breaks out this trend line.

image

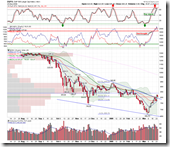
1.1.4 Nasdaq 100 Index Intermediate-term Trading Signals.  NDXA50R at the bottom of the chart is very close to 80, and the level of 80 is a top even in a bull market.  Of course, this also means we need to be patient for a few days.
image

OK, now let’s see how overbought the market is.

0.0.3 SPX Intermediate-term Trading Signals.  Overbought in the intermediate-term as you can see, both NYADV and NYUPV have made a historical high.

image

7.0.1 Extreme NYADV and NYMO Readings Watch.  Short-term overbought on the following chart.  The last time NYADV stayed for 4 days at the overbought level, but this time it may not stay that long in my opinion.

image

1.0.3 S&P 500 SPDRs (SPY 30 min) and 1.0.4 S&P 500 SPDRs (SPY 15 min).  Over the very short-term, overbought all over the charts for all applicable indicators, therefore I believe the market will pull back in tomorrow morning.

image

1.0.7 NYSE - TICK (30 min).  TICK is too high which means the market may pull back in tomorrow morning.

image

1.3.7 Russell 3000 Dominant Price-Volume Relationships.  Here is the biggest problem with today’s rally, 1592 stocks price up volume down.  Anyway, who cares? He he.

image

7.0.7 SPX and VIX Divergence Watch.  For your information only, VIX is reluctant to go down while the stock market is flying high.  Nothing beyond that.

image

Sunday, March 22, 2009

03/20/2009 Market Recap: Hey, don’t you see intermediate-term buy signal?

All intermediate-term signals on 0.0.0 Signal Watch and Daily Highlights are buy now, and I am not going to argue with them.  However my bottom line is that the normalized CPC on 2.8.1 CBOE Options Total Put/Call Ratio is way too bullish, so I don’t think this intermediate-term rally – if it does exist – could go too far.  In this report, I will show you what the profit/loss would be by following intermediate-term buy signal at the primary down trend, and this should be more meaningful than arguing whether the market would go up or down over the intermediate term.  The market has topped out over the short term, I believe, however it may bounce back up in the Monday morning and more likely close in red according to the statistics.

image 

7.2.3 Intermediate-term Trading Rule.  Note the blue dashed line on the chart.  Simply saying, it would be a consistent loss if one followed the intermediate-term buy signal to buy and then sell on the intermediate-term sell signal.  On the other hand, one could get a decent return by simply following the intermediate-term sell signal to short and then to cover on the intermediate-term buy signal.

image

Why is that?  Some people say TA signals don’t always work which is frustrated.  Well, does the above 7.2.3 which shows buy signal doesn’t work frustrate you?  A very important thing prior to using the technical indicators is to check out the trend over the longer time frame.  For instance, one must take the primary trend in count while trading the intermediate-term trend on 7.2.3.  The primary trend is down according to 7.3.0 SPX Long-term Trading Signals, and this is why the buy signal isn’t so useful compare with the sell signal over the intermediate term, right?

image

Now let’s go back to the analysis of the current market. On 0.0.3 SPX Intermediate-term Trading Signals, although intermediate-term signals are all buy, the momentum indicators on the top of the chart show that the market is overbought, which means it’s risky to go long at the current level.  Don’t forget 7.2.3, even going long at the intermediate-term buy won’t be consistently profitable, buy at the extremely overbought level will have no luck.

image

2.8.0 CBOE Options Equity Put/Call Ratio.  This is a re-organized chart.  Basically, any breakout on the trend line pinpoints at least a short-term top of the market, breakout of trend lines across major peaks are more likely a top in the intermediate-term.  Now you see at least a short-term top, don’t you?  The good news is the trend line across major peaks isn’t there, therefore the intermediate term rally might not finish yet.  However, I doubt how far this rally could go according to the normalized CPCE as I mentioned earlier.

image

1.3.7 Russell 3000 Dominant Price-Volume Relationships.  1587 stocks price down volume up, this is because the sell off is just a beginning so this reading is actually bearish which means the down trend may continue until the next price down volume up.  You may read the comments in blue on the chart and understand what I am talking about.

image

1.0.3 S&P 500 SPDRs (SPY 30 min).  STO is extremely oversold over the very near-term, so the market may bounce back up at least in the Monday morning.

image

2.3.4 Nasdaq Total Volume/NYSE Total Volume.  Here is a bottom sign.  However the assumption of this chart is that, Nasdaq is usually considered more risky/volatile than the broad market, therefore should the volume of Nasdaq be significantly lower than that of NYSE it means the funds are staying away from the risk, from contrarian’s perspective this scenario would be very bullish.  However according to 1.1.7 QQQQ Outperforms SPY Good Sign? Now the problem is that the funds are not afraid of risk but QQQQ way outperforms SPY, so I decide to overlook the bottom signal on this chart.  In fact, why NYSE volume becomes huge is because of the massive volume of financial stocks which are only one or two bucks, and the funds are not afraid of risks or staying away from Nasdaq market.

image

Disclaimer

The information contained on this website and from any communication related to the author’s blog and chartbook is for information purposes only. The chart analysis and the market recap do not hold out as providing any financial, legal, investment, or other advice. In addition, no suggestion or advice is offered regarding the nature, profitability, suitability, sustainability of any particular trading practice or investment strategy. The materials on this website do not constitute offer or advice and you should not rely on the information here to make or refrain from making any decision or take or refrain from taking any action. It is up to the visitors to make their own decisions, or to consult with a registered professional financial advisor.

This websites provides third-party websites for your convenience but the author does not endorse, approve, or certify the information on other websites, nor does the author take responsibility for a part or all materials on the third-party websites which are not maintained by the author.