The market went down on the Friday but many people are happy because it might be a chance to catch the train. Is this the first time people are happy about the downside movement? I have never seen the market keeps bullish regardless of continuous down, and it seems no bad news could pull back the market. 1.0.0 S&P 500 Large Cap Index (Daily) looks strong too, two days down could not even claim back the rally of previous two days up, which means the trend is strong. However, Don Worden in Telechart considers it a Bear Flag, and doubt the current trend: There is an old stock market maxim about the news and the market. It goes something like this: "Never trust a market moving obviously in response to specific news." I think a lot of us have violated this admonition in recent months, particularly involving the market's relationship to the price of oil, but also in response to a wide variety of geopolitical and domestic economic events (and threats of events) as well. On the other hand, John Murphy concludes from the Fibonacci retracement: Odds now appear to favor a retest of the July lows.
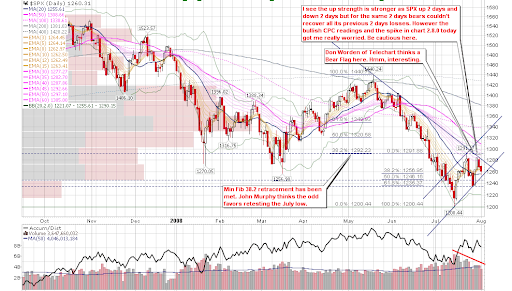
I don't know who is right, but my signals do not support the market to go further up.
2.8.0 CBOE Options Equity Put/Call Ratio. It spiked Friday. According to the past situations the rally is likely over, and this signal has been accurate since the last year. If next Monday it spikes up further, it will be very likely the rally is indeed over.

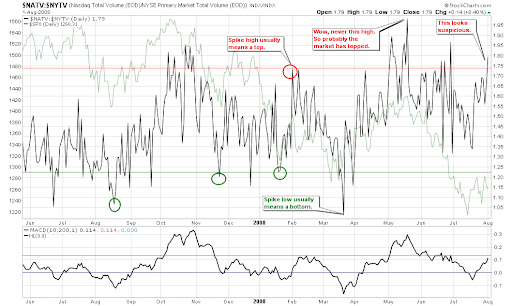
2.3.4 Nasdaq Total Volume/NYSE Total Volume. This chart is highly accurate too. The spike last Friday worries me. Again, if it spikes further next Monday, it will very possible the rally is over.
1.0.9 S&P 500 Bullish Percent Index. This chart might be more different to comprehend. INDU sell signal. Over the history on the entire chart, INDU sell signal has less number of whipsaws, and thus the most accurate one, moreover INDU always gives the buy/sell signals first recently. If you are convinced by 0.0.3 INDU leads the Market (so far the prediction has been correct for 2/3, the last 1/3 is due), you should pay attention to this INDU sell signal.

In this weekend, I received an email from a reader, the question is why I short even I do not have a confirmed sell signal?
Good question. We have warnings, the highly accurate warnings proven in the past, but our mid-term signals are still buy, should we override these mid-term signals? It's your decision to make. The mid-term signals are usually lagging indicators, very often when the signals change you have incurred a significant loss. Therefore, occasionally overriding mid-term signals are not a terrible trading strategy. At the moment I have no idea what kinds of bad news could hammer down the market, so I tend to not override these signals. However these warnings are to be listened, so my solution is to short some weak and overbought sectors for the hedging purpose.
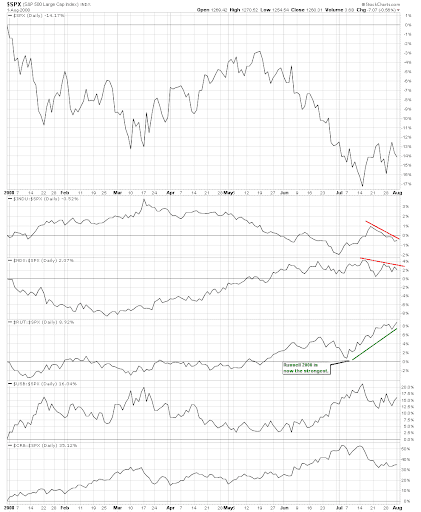
In the following let us check out which index is relatively weak.
1.0.8 S&P 500 Large Cap Index Year-to-Date Performance. On the chart, in term of relative strength INDU and NDX (QQQQ) are relatively weak. By the way RUT (Russell 2000) is relatively strong. So the first candidate should be IWM if you want to long an index.
1.1.B QQQQ and VXN. The old friend NAMO is still very close to the overbought region.
1.1.4 Semiconductor Holders (SMH Daily). Note the relative strength marked by the red circle, the semiconductor as an important component of COMPQ is very weak, and it is hard to imagine COMPQ is going strong when the semiconductor is still weak.
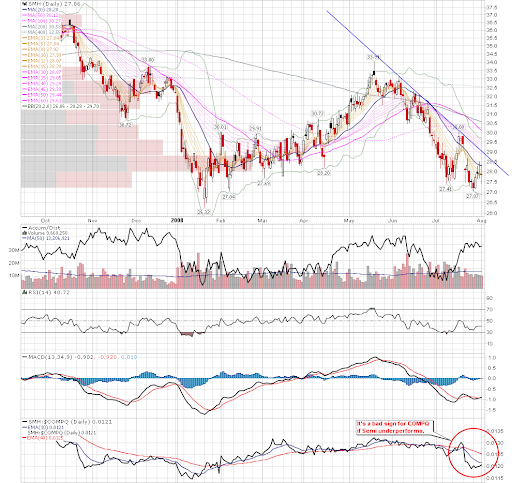
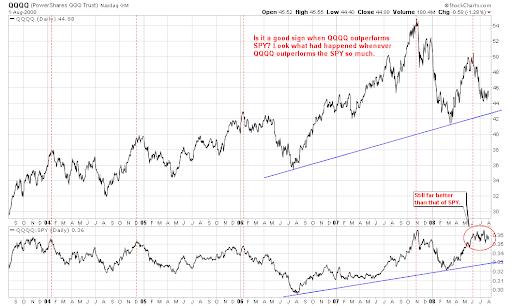
In addition, 0.0.4 QQQQ Outperforms SPY Good Sign? is still quite high. I think it will cause a problem eventually.
Therefore, among all indices the target to short is obvious... please welcome QQQQ (applause... more applause)
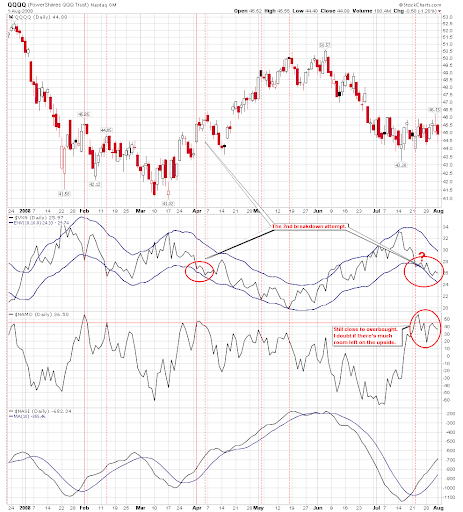
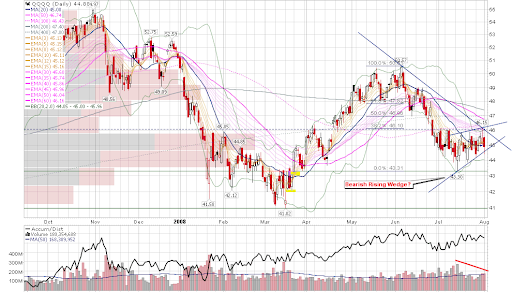
1.1.6 PowerShares QQQ Trust (QQQQ Daily). Here is a Bearish Rising Wedge.
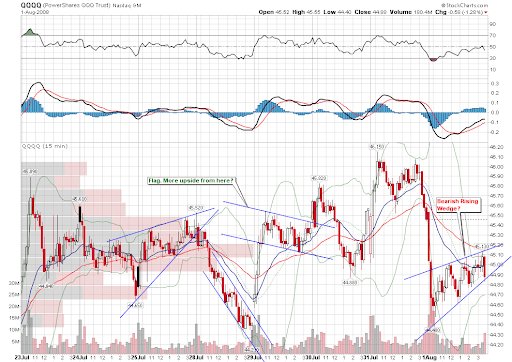
1.1.A PowerShares QQQ Trust (QQQQ 15 min). Another Bearish Rising Wedge on the intraday chart.
As aforementioned, I tend to believe in my signals instead of rushing to long due to the fear of missing the boat. In term of strategy, I will hold my current long positions according to the NYSI signal, and short QQQQ for hedging at an appropriate point.
1.0.4 S&P 500 SPDRs (SPY 15 min), 1.2.7 Diamonds (DIA 15 min). Both show Bearish Rising Wedges.
1.3.0 Russell 2000 iShares (IWM Daily). The pattern looks like a Symmetrical Triangle, 75% probability of continuously going up.
1.4.0 S&P/TSX Composite Index (Daily). Here is an Ascending Triangle. We need to see if the oil price will go up.
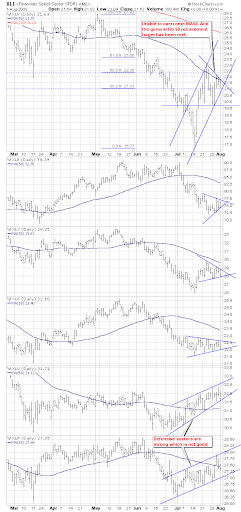
1.0.7 Select Sector SPDRs. It looks nice to put sectors on a single chart so I added this chart. The purpose is not to predict which will go up or down, but to check the relative strength of each sectors and finally find the strongest sector to long, and the weakest sector to short. On the chart, fancy sectors are showing triangles and the direction isn't clear. On the other hand XLV and XLP as defensive sectors tend to go up. The overall picture is that the money is defensive, which is a typical sign of the bear market.
0 comments:
Post a Comment