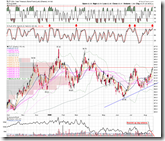
0.0.1 Simple SPY Trading System, previous low, 20 days moving average as well as the trend line still hold as the support. According to my climax run statement, the pullback today shows the market is healthy. However it will not be so if we see another selling off as violent as today's one. If it happens, you'd better not jump in too early and wait for my analysis prior to any action.
5.3.0 Financials Select Sector SPDR (XLF Daily). XLF leaded today's selling off but has not broken the support although it is not very close to it. On the chart, it seems the number of consecutive down days of XLF seems always more than one. So tomorrow it may go down further, but the heavy selling off will be bad.
Now the question is, is it possible that the support holds firmly tomorrow?
The answer is, very possible.
1.1.C TRINQ Trading Setup shows the sign of possible rebound tomorrow. Both TRINQ and TRIN are higher than 2.0, which is over bearish, so the market may bounce back. So far the success rate is 11/16.
1.0.3 S&P 500 SPDRs (SPY 60 min). On the 60-min chart, it is obvious that the Rising Wedge has not broken yet. Note that RSI is on the support, so there is a chance of rebound tomorrow.
1.1.8 PowerShares QQQ Trust (QQQQ 60 min). The RSI support on the QQQQ 60-min chart has never broken since July. So it will probably not this time.
3.0.3 20 Year Treasury Bond Fund iShares (TLT Daily). TLT is overbought, and STO is testing the resistance. Most importantly it has rallied for three days but the volume kept decreasing, which is a bearish pattern. Tomorrow it might pull back and cause the money flows back to the stock market. Note that the anti-correlation between the bond market and the stock market is not completely confirmed, and the movement of TLT is not entirely against the stock market direction. Further investigation needs to be carried out to confirm this analysis.
1.4.2 S&P/TSX Composite Index (60 min). On the 60-min chart of the Canada market, both MACD and RSI show positive divergence. Although it failed to rebound, tomorrow it might succeed.
1.5.0 Shanghai Stock Exchange Composite Index (Daily). Now I put $HSI and FXI together on a single chart, and hopefully can get more insights. I guess the China market leads. Now $SSEC broke the support, FXI may follow soon. Let's wait and see.


0 comments:
Post a Comment