Tomorrow is the Fed day. Concerning the Fed day, my experience is:
- Lock some part of the profit before 2:15pm;
- The market will act like a roller coaster -- go up hundreds of points in minutes, go down hundreds of points in minutes, and maybe go up again for hundreds of points... so experienced traders will take a rest;
- The real direction of the market will not be clear until a few days later. So if the market closes green tomorrow, bulls don't need to be cheerful, on the other hand if the market drops bears should not feel excited as well.
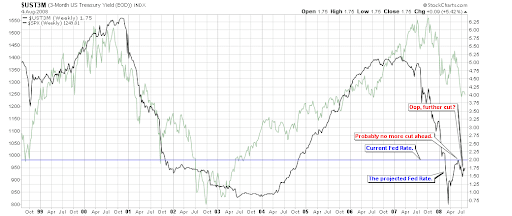
Tomorrow the Fed may keep the rate unchanged. On 3.0.8 Projected Fed Rate, the Fed rate will align with three-month T-Bill eventually. Now T-Bill is lower than the benchmark rate for 0.25, which means, in theory (well, in theory only) the Fed would cut the rate further for 0.25 point.
Now let us discuss a pattern which was used to be very accurate but failed today.
2.1.0 S&P 500 SPDRs (SPY 5 min). I said if TRIN was constantly lower than 1 and (especially) the Japanese Yen was dropping at the same time, the market would normally close green. Unfortunately this pattern failed today. What I mean is that, whatever pattern is all about probability, no one will be 100% accurate or reliable forever.

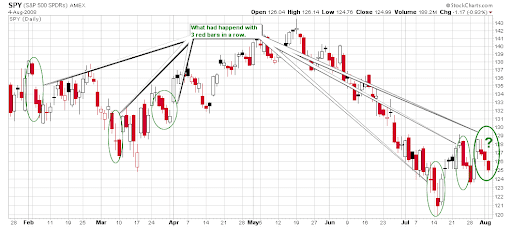
With the aforementioned pattern in consideration, now look at another pattern which happened today, SPY down 3 days in a row, especially all are red candles, what happened the next day? What happened afterward?
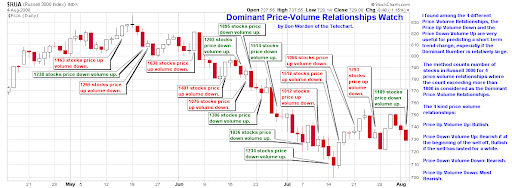
1.3.7 Russell 3000 Dominant Price-Volume Relationships. The dominant price volume relationships today were 1189 stocks price down volume up, which means the market is oversold. Note the green comments on the chart, the probability of going up next day is quite high after consecutive days of dropping.
As a summary to two factors explained as above, tomorrow the market has a high probability of going up.
Among three warnings mentioned in the weekend report, one of them has been confirmed, another one is under watch.
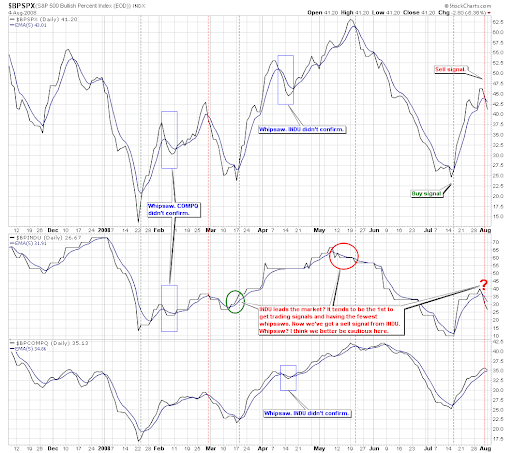
1.0.9 S&P 500 Bullish Percent Index, SPX shows a sell signal which is the first mid-term sell signal so far. Take notice that once the buy/sell signal has been confirmed by all three indices, it will be highly reliable. Therefore it is prudent to watch if COMPQ will give a sell signal soon.
2.8.0 CBOE Options Equity Put/Call Ratio. This has not been confirmed today since it is possible to draw another trend line which also looks reasonable. So the warning is clear, but still be cautious.

The conclusion is to be cautious. I am not completely sure whether the mid-term outlook is bearish or bullish before watching for a few days more.
1.1.6 PowerShares QQQ Trust (QQQQ Daily). This looks like the Bearish Rising Wedge has broken.

1.1.4 Semiconductor Holders (SMH Daily). The Semiconductor chart looks quite bearish, lower low, and weak rebound on decreasing volume.

The conclusion is that the COMPQ is still weak. NAMO on 1.1.B QQQQ and VXN has backed off from the overbought region, but the distance is not enough and it may easily go there again. Therefore, as what I said in the weekend report, it is still okay to short QQQQ as a hedge.
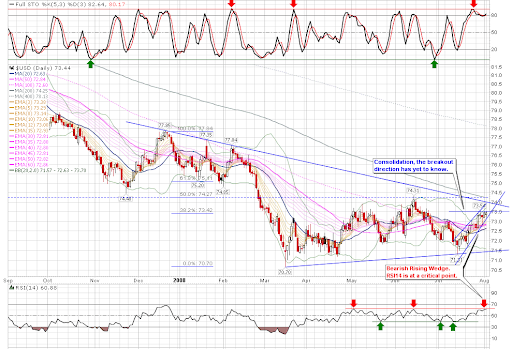
3.1.0 US Dollar Index (Daily). The recent few candles looks like consolidation, and the breakout direction is unknown. But the pattern is a Bearish Rising Wedge and RSI(14) is testing the resistance, as a result US dollars doesn't seem so well although hope is still there.
3.2.0 Japanese Yen (Daily). It is still on the support.
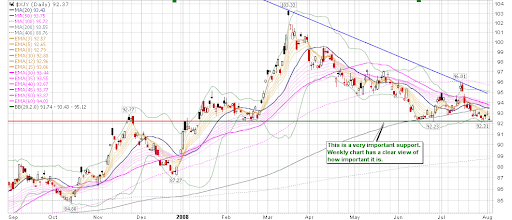
Note that the movement of these two may be critical to the stock market.
0 comments:
Post a Comment