The only useful conclusion today is: there are a few bearish signals but they are not deterministic. If the market does not correct these signals but rises further, it will be a good chance to short.
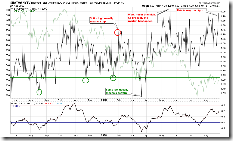
2.3.3 NYSE Total Volume. It went down further and looks very bearish. Some people may claim this is connected with the labor day long weekend, but it wasn't like this in the end of last August on the chart.
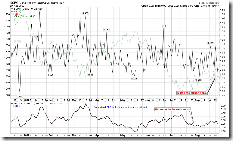
2.3.4 Nasdaq Total Volume/NYSE Total Volume. It is a bit too high and won't look good if QQQQ rises tomorrow.
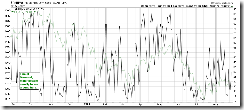
2.8.1 CBOE Options Total Put/Call Ratio. It is merely 0.82 which is too bullish. If CPC dives down tomorrow, the situation will not be good.
By the way, recently the momentum has been quite weak, and the breadth indicators often give bearish warnings. On the other hand, it is interesting that no mid-term sell signal ever shows up on 0.0.0 Signal Watch and Daily Highlights. Take a look at the following chart, it is green, isn't it?
In addition, 2.3.0 NYSE High-Low Index is too close to the oversold region. Consequently the downside space is limited even the market violently sells off from now on.
Therefore, at the moment I am not sure whether the market will go up or down in the mid-term, most likely SPX will oscillate between 1260 and 1290 until a breaking event happens.
As aforementioned, the market would better to correct a bit in order to be bullish in the mid-term. Will it go up or down tomorrow? There is no deterministic signal, although I incline to up first and then down.
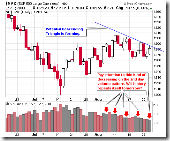
Here is the reason why the market may go down eventually tomorrow. Note the volume pattern, if the volume doesn't keep up during the second day's rally, the third day may likely be a down day.
1.0.4 S&P 500 SPDRs (SPY 15 min), 1.1.A PowerShares QQQ Trust (QQQQ 15 min), 1.2.7 Diamonds (DIA 15 min). These 15-min charts show why the market pulled back several times. The pattern on last Friday looks like an Island Reversal and the gap should be a resistance. However, MACD and RSI don't show negative divergence so the market could go up in the morning and probably will break today's high, such that MACD and RSI will show negative divergence and finally the market will roll over.
1.4.3 S&P/TSX Composite Index (15 min). In order to have a better understanding of negative divergence of MACD and RSI, let's take a look at the Canada market. On the chart, MACD and RSI have formed negative divergence, so the probability of selling-off tomorrow is high. You may also take a look at 3.3.0 streetTRACKS Gold Trust Shares (GLD Daily) and 3.4.1 United States Oil Fund, LP (USO Daily). A black candle, which often means reversal, shows up on the daily charts of gold and oil. This isn't a good news to TSX which is heavily influenced by gold and oil. In plain English, tomorrow TSX may fall.
1.4.4 TSE McClellan Oscillator. This chart has improved significantly. Note that the black candles in the middle is rising finally. At the same time, the golden candles (refers to new 52 weeks low) at the background of black candles are falling continuously, which is also a good sign. TSX market is gaining strength.


Great Stuff over the past few weeks I have always enjoyed your analysis
ReplyDeleteThanks. Glad to hear that. :-)
ReplyDelete