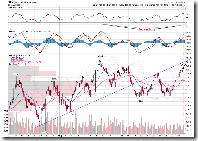
0.0.1 Simple SPY Trading System has no material change today. The mid-term direction is still undetermined because of no higher high, so we have to wait and see tomorrow's market. Now bulls are facing an improved situation as the frontline has been pushed to the upper range, and it will be bears' turn to defend itself.
0.0.0 Signal Watch and Daily Highlights. Take a look at the summary of all signals. Mid-term signals are all green, but there are several new orange warning signals which mean near-term overbought, that's it. You may like to pay more attention to this chart, which clearly and briefly show the mid-term and short-term situations. For new traders, you just follow the mid-term signal and disregard the up and down everyday. For fast hands, you may do counter-trend trades according to occasional warning signals, which of course is riskier.
In the short-term, we have a few reliable breadth indicators are overbought or close to overbought. So if the market rises tomorrow, I believe the short trades will have a high probability of success -- unless we are in a Final Climax Run which has been talked for a long time.
2.2.1 NYSE McClellan Oscillator. It is a bit too high.
2.4.2 NYSE - Issues Advancing. It is a bit too high as well.
2.8.1 CBOE Options Total Put/Call Ratio. This is over bullish.
1.0.3 S&P 500 SPDRs (SPY 60 min), 1.2.3 Diamonds (DIA 60 min), RSI overbought. Of course, RSI sometimes can stay as overbought for very long. However, this doesn't happened recently according to the chart even during the mad rally after July 15th. Therefore in term of probability, the market is due for a pullback tomorrow.
1.0.4 S&P 500 SPDRs (SPY 15 min), 1.1.A PowerShares QQQ Trust (QQQQ 15 min), 1.2.7 Diamonds (DIA 15 min). You may notice that the second day pullback has been accurately predicted by the negative divergence of MACD and RSI on the 15-min chart. As a result, tomorrow the market will likely pull back.
1.4.3 S&P/TSX Composite Index (15 min). MACD and RSI show negative divergence on the Canada market. The prediction yesterday is inaccurate. Tomorrow it might pull back.
3.0.3 20 Year Treasury Bond Fund iShares (TLT Daily). STO is overbought and TLT is due for a pullback. Take notice that Bond is not always anti-correlated with the stock market (denoted by SPX). Therefore it is normal that Bond went up today with the rising of the stock market.
2.0.0 Volatility Index - NYSE (Daily). VIX didn't go down much. Just for your information.


0 comments:
Post a Comment