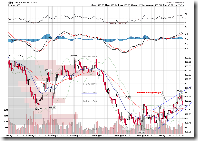
0.0.1 Simple SPY Trading System, today's rally is very weak, since the two days of rally hasn't claimed a half of loss, up on decreased volume. The chart pattern looks like a Bear Flag, very bearish.
1.0.4 S&P 500 SPDRs (SPY 15 min), Bearish Rising Wedge on the 15-min chart, and the price peak today is right at Fib 50, at where the retracement usually stops. So I feel very bearish.
On the other hand, I had expected that INDU might plunge for two or three hundred points based on the huge rally of both Japanese Yen and crude oil. Eventually the market went up. Maybe tomorrow we still have a little bit of hope.
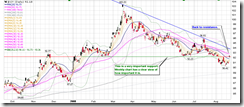
3.2.0 Japanese Yen (Daily). Look at how big the rally of Yen is, what an amazing gap up! The good news is that it hits a strong resistance, and might pull back tomorrow.
3.4.1 United States Oil Fund, LP (USO Daily). USO also gapped up dramatically, and it also hits a strong resistance and it's overbought at the moment. Hopefully it could pull back tomorrow.
Does the rally of SPX have any connection with the strong Energy sector? The following chart shows that the pulling-up during the trading hours was not caused by the Energy sector. Probably SPX could continue its rally tomorrow. On the other hand, even in case it rallies, the pattern will be still a Bear Flag if it closes at a small candlestick, and finally the trend will be down anyway. Therefore at least close part of your long position.
QQQQ has a higher chance of rebound tomorrow. These two days the candles have a high probability of reversal.
1.1.A PowerShares QQQ Trust (QQQQ 15 min), MACD and RSI show positive divergence.
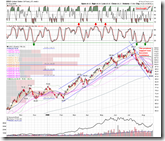
1.1.4 Semiconductor Holders (SMH Daily), oversold, and STO is at the lowest level ever, which will help QQQQ to bounce back.
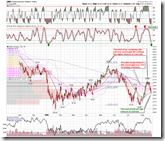
1.3.0 Russell 2000 iShares (IWM Daily). IWM also has a chance of rebound since the STO is on the support. 1.3.6 Russell 2000 iShares (IWM 15 min), MACD and RSI show positive divergence as well.
2.3.0 NYSE High-Low Index. It is still very close to the oversold region which gives a bit of hope to bulls. However note that during the beginning of July, this indicator was staying in the oversold region while the market didn't bounce back significantly. I guess this time won't be an exception.
2.3.3 NYSE Total Volume. Note the red circle at the bottom of the chart. This chart looks very bearish, what we can hope is merely a small rebound.
2.0.2 Volatility Index 30-day/90-day Ratio, Market is doomed. Even if we get a big rally, this chart shows that the upside room of the market is limited. I am even thinking why we are waiting for a rally? It seems a winning trade just short from here based on this chart.
Conclusion: the market leaves a little bit of hope to bulls. Based on the breadth indicators, what we can hope at the moment is nothing more than a rebound.


Peak in Subprime = market down + or - on expectation
ReplyDeletethe reduction in subprime resets will help the financials.
http://siliconinvestor.advfn.com/readmsg.aspx?msgid=24814415