Firstly I'd like to give you the conclusion: Monday the market may pull back further, probably it will be quite weak during the entire week. But I do not think the market is topped at the moment, and the pullback is a good chance to buy dip.
Take notice at following two points:
- if the market doesn't pull back but goes up next week, do not chase it, actually it will be necessary to lock the profit.
0.0.2 Market Top/Bottom Watch is the evidence why the market has not topped. Note the red dashed line, every time when the market topped, VIX stretches out of the lower edge of ENV, and now it is close but has not there. This is why I believe it's highly possible that market is not topped, on the other hand, it also shows why we should lock profit instead of chasing high if the market goes up next week. Every time when VIX breaks down the ENV, the market might be potentially topped.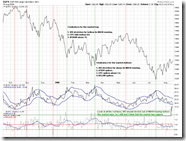
- Do not buy dip on the day when the market plunges. Wait for the reversal signal prior to any action.
1.0.0 S&P 500 Large Cap Index (Daily), 1.2.0 Dow Jones Industrial Average (Daily). Two indices didn't even claim the two previous days' loss when the US dollar and Japanese Yen soared last Friday. This is a sign of weakening momentum, and might be an early warning of the trend reversal. Note that the Bearish Rising Wedge is very obvious, so the outlook is not optimistic. Because it is unclear that continuous diving down will happen to break the Rising Wedge, it's better not to buy dip at the pullback day. Better safe than sorry.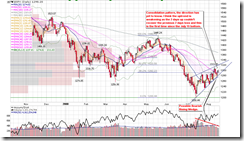


1.0.5 S&P 500 Large Cap Index Year-to-Date Performance. On the chart it shows INDU is the weakest and may lead the downtrend. Therefore it could be the short candidate.

1.3.7 Russell 3000 Dominant Price-Volume Relationships. This is the main evidence why I think the market will pull back on Monday. The dominant Price-Volume Relationships on Thursday is 1314 stocks price up volume down, there is no dominant Price-Volume Relationship on Friday and Russell 3000 rallied a bit. According to my past investigation, very often the pullback will be postponed for a day after the Dominant Price Up Volume Down , which means the next Monday the market may go down.
NAMO on 1.1.B QQQQ and VXN is still overbought. COMPQ is due for further pullback.

1.1.0 Nasdaq Composite (Daily), right below the resistance.
1.1.8 PowerShares QQQ Trust (QQQQ 60 min). MACD and RSI show negative divergence.
1.1.A PowerShares QQQ Trust (QQQQ 15 min). Descending Triangle, and the target is 47.43.

1.3.2 Russell 2000 iShares (IWM 60 min). Bearish Rising Wedge. MACD and RSI show negative divergence.
3.2.4 Yen RSI and the Market Bottom. When Yen is at the red line level, the market usually reached a short-term top.

As a summary, the market may pull back on Monday.
1.1.2 Nasdaq Composite (Weekly). It has not broken the major downtrend line. COMPQ has rallied for five weeks, which is rare even in a bull market. Therefore the pullback next week is a reasonable expectation.

1.3.1 Russell 2000 iShares (IWM Weekly). It has rallied for six weeks, which is rare even in a bull market. So it is due for a pullback.

5.0.2 S&P Sector Bullish Percent Index. BPENER is almost at the historical low. So maybe it is an entry point for XLE.

5.2.0 Energy Select Sector SPDR (XLE Daily). MACD is buy signal already. RSI and STO show positive divergence.

5.2.3 Energy Select Sector SPDR (XLE 60 min). MACD and RSI show positive divergence.
5.0.1 Select Sector SPDRs. Since the rally on July 15th XLF has not formed a higher high, obviously the momentum is weak. The aforementioned analysis shows XLE may rebound soon. Considered that XLF and XLE are anti-correlated, the rally of XLE may further weaken XLF. Therefore the market will look weak next week.

As a summary of aforementioned analysis, on the weekly chart we will very likely see a red candle next week.
1.4.4 TSE McClellan Oscillator. Buy signal. By the way, this is invented by me, not McClellan, although I borrow his idea. Considered that XLE is potential buy, TSX on the Canada market will likely rebound. RHTSX at the bottom of the chart is still oversold, so the probability of rebound is high.

3.1.1 US Dollar Index (Weekly). It is now confirmed breakout. Note the RSI and STO on the top of chart, US dollar may have upside room, so does the market.

3.3.1 streetTRACKS Gold Trust Shares (GLD Weekly). GLD may be on the support. But STO shows more downside room. Take notice that the "Bump and Run Reversal" comment has been put there many days ago.

3.4.2 United States Oil Fund, LP (USO Weekly). STO shows further downside room.
0 comments:
Post a Comment