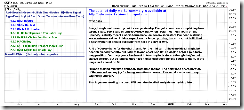
Today I received an email of complaining my inaccurate prediction. Then I realized the yesterday's title is not entirely accurate, or in some sense a bit misleading. When I said "not much room left on the upside", I meant short-term we should expect a pullback. Obviously the market pulled back significantly in the mid-day, which show my analysis is correct although the market finally went up. My concern is that a few indicators are not corrected to the right level due to the afternoon rally, which is not a good news for bulls. Anyway I will make my analysis clear in term of timing, i.e. short-term or mid-term, as it is expressed on 0.0.0 Signal Watch and Daily Highlights.
The indicators I discussed yesterday have not changed so much today. But tomorrow is the last day of July, and it is time to validate my previous observation that at least two months down in a row in a bear market on 1.0.2 S&P 500 Large Cap Index (Monthly). Currently the candle is a cross. I have no strong evidence to show tomorrow the market will be down, but it's a bit overbought on 5-min and 15-min intraday charts, so tomorrow we should see at least a pullback.
2.8.1 CBOE Options Total Put/Call Ratio. This has worried me for a while. According to Dr. Brett Steenbarger's observation on MA(10) and MA(200) of CPC, when MA(10) was below MA(200) usually the market was topped out. Of course the problem is that it is not clear how deep the MA(100) goes below MA(200) the market will be at the top precisely. In the past, -0.1 is near the top, and now it is not there yet, nevertheless it's better to be cautious. During the March rally, MA(10) was above MA(200) for a month and then went below for a month. Now MA(10) has stayed below MA(200) for 10 trading days, which is about a half of one month (or 20 trading days). And that's a part of the reason why I said "not much room on the upside". I am not saying the market will go down immediately, it is not entirely impossible that the market goes up 200 points in a day, or 2000 points within 10 days. I probably should say not much time left. Anyway, this chart does tell you the immediate direction, it just remind you where the market is at the moment.
1.1.B QQQQ and VXN. Yesterday I said NAMO was nearly overbought, now it is. You may have witnessed the accuracy of overbought Breadth indicators. Therefore if QQQQ continues to rally tomorrow, I think the probably of shorting could be fairly high.
2.2.1 NYSE McClellan Oscillator. It is a bit high but not overbought yet. Just a warning.
3.1.0 US Dollar Index (Daily). The important test that I mentioned yesterday has not passed yet. Tomorrow the test will continue.
3.2.1 Japanese Yen (Weekly). Japanese Yen is still on a key support. On the 15-min chart, it was pulled up impressively. If tomorrow it follows through, it is going to be very bearish to the stock market.
3.3.0 streetTRACKS Gold Trust Shares (GLD Daily). The triple support is now broken, as I predicted in the weekend report.
Conclusion: the probability of pullback tomorrow or the day after tomorrow is high. The market will be very unlikely to go up the second day after tomorrow. I keep skeptical to how long the rally will last, but I will go long by following NYSI signal anyway. By skeptical I mean when the market is extremely overbought, it is wise to make short-term counter-trend short. Please keep a eye on the short-term signals on 0.0.1 Simple SPY Trading System.


2cents,
ReplyDeleteIf you had followed cobra long enough you would have profited from his comments by shorting this market long ago. "Cobra's Market View" is a new site. He has a second site under stockcharts Public Chart Lists: http://stockcharts.com/def/servlet/Favorites.CServlet?obj=ID2393449&cmd=show[s124013638]&disp=O
In my opinion cobra/Yong Pan is one of the best trader I have ever known (if not the best). And it's too bad he doesn't have a pay subscription site.
reff
''Today I received an email of complaining my inaccurate prediction''
ReplyDeleteHey!
complaint??he should give you a break.
you have an excellent site and excellent point of view in my opinion.
why should someone complain if even is a free site and an excellent work??
thanks for your nice work cobra,
LV,Portugal
daily reader
* sorry for my english
You do a great job with your market analysis. It is not possible to be 100% accurate but you do a good job keeping the odds in your favor at all times.
ReplyDeleteThe market is difficult right now for everyone; whether they are bull or bear and whether they rely on technical or fundamental analysis.
Your charts are very good and I look at them daily
Thank you guys!
ReplyDelete