If the market had run up today, it could be a climax run and would be topped out soon. Now it pulled back and this looks quite healthy so far. On 0.0.1 Simple SPY Trading System there are several higher lows. As long as the low on the blue trendline is not broken, the uptrend will be still intact. Pay attention to this low if the market continues to sell off.
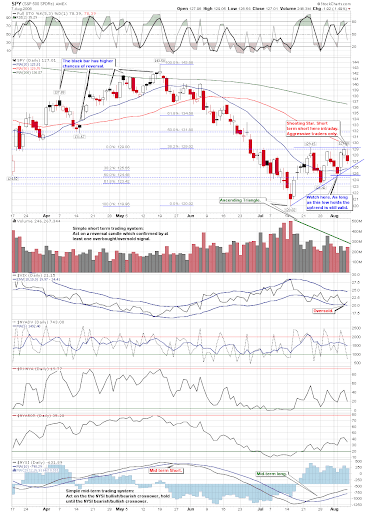
1.0.9 S&P 500 Bullish Percent Index, this has been proven to be a whipsaw. COMPQ does not confirm the sell signal so the mid-term signal is still buy.

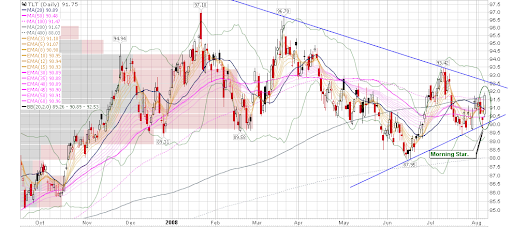
3.0.3 20 Year Treasury Bond Fund iShares (TLT Daily). This is my concern. It rallied a lot, and the candlestick is a Morning Star, which has a relatively accurate pattern. This means the bullish trend of TLT will likely be continued, and this is bearish to the stock market since the money will fly to safety and the bond market.
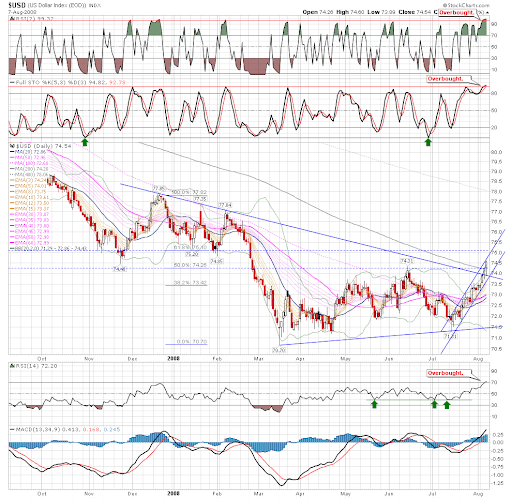
3.1.0 US Dollar Index (Daily). US dollar is invincible as expected but it is seriously overbought, especially STO has reached a record high level. This means pullback is due. In addition, oil has sold off miserably and probably needs to take a rest. This is possibly bearish to the stock market.
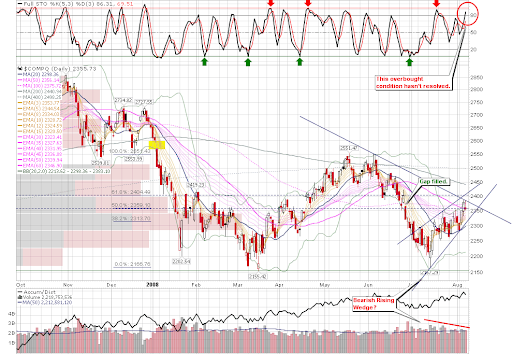
1.1.0 Nasdaq Composite (Daily). Note that STO is still quite high, so is it on 1.1.6 PowerShares QQQ Trust (QQQQ Daily). Therefore I do not really believe QQQQ will go further up significantly although it was quite bullish today.
1.1.4 Semiconductor Holders (SMH Daily). Here you can see why QQQQ was so bullish. SMH broke out and got overbought as well.

As a summary, I guess the market will pull back a bit. There is no solid evidence that the big trend is changed, so the game is still buy dip, sell bounce. Of course a lower low should not be formed if the pullback continues tomorrow. On the other hand, keep an eye on 2.8.0 CBOE Options Equity Put/Call Ratio, where $CPCE is close to the trendline again. For a more accurate $CPCE data during the trading hours (note the comment on the chart), you may refer to data on CBOE. But you have to calculate the ratio of Puts/Calls in Equity Options column manually. Usually the intraday ratio isn't so different from the ratio at the market close.

You have some of the most detailed charts on stockcharts, easily in the top 3 in my book. Would you like to exchange links to increase traffic? Happy trading.
ReplyDeletewww.zentrader.ca
jeff@zentrader.ca
thanks!
jeff
Sure, done, thanks!
ReplyDeleteGood for people to know.
ReplyDelete