Firstly here is the conclusion: next week the market may start another ledge down to test the July 15 low. If the market rallies on Monday and Tuesday, do not chase high. If it pulls back on Monday and Tuesday, check the trend strength according to the following chart -- if support denoted by the red line still holds during the three days of pullback, maybe the uptrend is ok and buying dip is fine.
I have concern to two indicators, which positions are certainly bearish to bulls and at least means the upside room is limited.
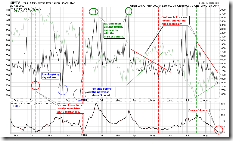
2.0.2 Volatility Index 30-day/90-day Ratio. The way to read this chart has been introduced in How to Read Breadth Charts in Cobra's Market View. Some may say the reliability of this chart is not high because of its short history. However, think about the 90-day expected volatility is much higher than the current volatility, it means the mid-term trend is upward, doesn't it?
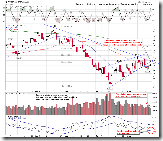
2.3.3 NYSE Total Volume. Some people may have different opinions on this chart. But we have to admit that the market is going in a similar way with the one in this May -- prices going up and volume going down, which means the institutions are not heavily involving and the current rally is not a broad based one. If this situation goes not change, the rally will not be sustainable.
Now let's read the weekly chart.
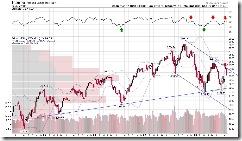
1.0.1 S&P 500 Large Cap Index (Weekly), 1.2.1 Dow Jones Industrial Average (Weekly). Very likely the pattern is a Bearish Rising Wedge.
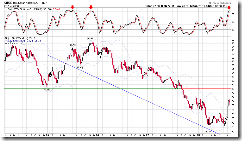
1.1.2 Nasdaq Composite (Weekly). It has been blocked by the primary downtrend line for two weeks. My feeling is bearish because of the fact that a Hanging Man like candle shows up at the key resistance. The RSI indicator at the top of the chart looks like a pivot point in a bear market.
3.1.1 US Dollar Index (Weekly). US dollar has been pushing up the stock market, now it is facing the resistance on STO.
3.2.1 Japanese Yen (Weekly). Japanese Yen is the opposite as it is on the STO support. The combination of weak 3.1.1 and strong 3.2.1 seems bearish to the stock market.
3.4.2 United States Oil Fund, LP (USO Weekly). The oil is on the support of STO.
3.3.1 streetTRACKS Gold Trust Shares (GLD Weekly). Similarly, GLD is on the STO support, too. The means the commodity may bounce back which is bearish to the stock market.
According to aforementioned analysis, the mid-term trend is bearish.
What about the near-term trend, e.g. the next week? I am not sure if there will be a pivot point. On the daily chart, SPX and INDU may start pullback on Monday, on the other hand QQQQ and IWM may continue higher.
1.3.7 Russell 3000 Dominant Price-Volume Relationships. The dominant price-volume relationship is 1348 stocks price up volume down, so the chance of market down on Monday or Tuesday is very high.
0.0.1 Simple SPY Trading System. Price went up for three days but volume kept going down. For this pattern, on the fourth day which is the next Monday, the probability of down is high. Note the VIX ENV, SPY on 15-min chart may be a Ascending Triangle so it might break upward but this would cause VIX breaks ENV. On 0.0.2 Market Top/Bottom Watch, every time VIX break ENV downward the market is potentially topped. Therefore if the market rallies next Monday, I will consider it a good opportunity to short.
1.0.3 S&P 500 SPDRs (SPY 60 min), 1.2.3 Diamonds (DIA 60 min). On the charts, the Friday rally looks like a typical testing back the breakout point after a breakout of the rising wedge.
1.0.4 S&P 500 SPDRs (SPY 15 min), 1.2.7 Diamonds (DIA 15 min). The patterns look like a Ascending Triangle but MACD and RSI shows a bit of negative divergence. Considered that the breakout of ascending triangle is dual directional, likely this time it will breakout downward. I am saying it is impossible to break out upward, however shorter time frame will be overridden by longer time frame if the latter (e.g. the daily chart) is bearish. I wish it could break out upward -- because that would be a perfect short entry since the big trend is down and upward breakout means four days of rally.
1.1.6 PowerShares QQQ Trust (QQQQ Daily), 1.3.0 Russell 2000 iShares (IWM Daily). Morning Star, so the probability of further rally is very high.
1.1.C TRINQ Trading Setup. This chart says QQQQ may pull back on Monday. My statistics shows that the edge of TRINQ setup is marginal. If the chart is inaccurate again on Monday, the success rate is merely 61% and the edge is indeed small. Then I will drop it. Let's give this chart one more chance.


very nice charts. that VIX:VXV one is particularly interesting.
ReplyDeleteone thing I've been using which has been helpful is watching for pos/ neg divergences btw financials and the general market, in this case SPY/ UYG. Back in May UYG rolled over well before SPY did. A pretty good leading indicator. And right now there is pretty major divergence btw them now.
http://tinyurl.com/6e2c75