Today the market soared, and bulls are quite excited. Well, it is probably a bit over-bullish since two key indicators are very close to reversal region, so I doubt the further upside room. My gut feeling is that the July 15 market bottom might not be very mature due to the external intervention, as a result several key indicators frequently get overbought and the market may keep range bounding to test if you have a brave heart.
Anyway, the NYSI mid-term buy signal on 0.0.1 Simple SPY Trading System is to be followed. Reversal candle as well as heavier volume, so today one should partially buy in. There is no 100% accurate trading signals, the key to success is persistence and following the probability over the long term.
Why do I doubt the rally? Here are the reasons.
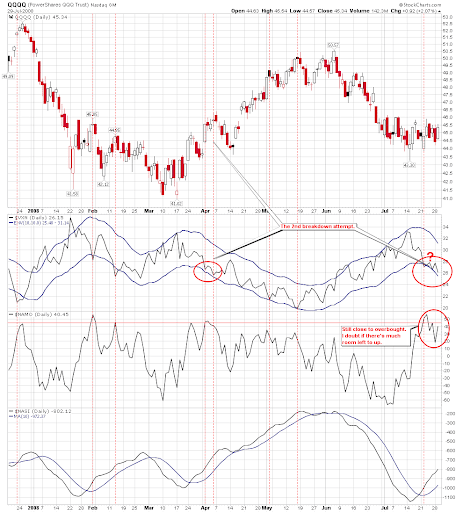
1.1.B QQQQ and VXN. Note the NAMO is near overbought. If the market continues to go up, ... you know what will happen.
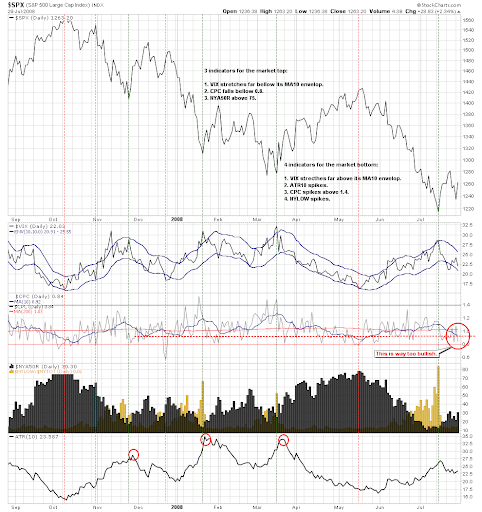
0.0.2 Market Top/Bottom Watch. Maybe it is more obvious on 2.8.1 CBOE Options Total Put/Call Ratio, but 0.0.2 is a big picture. Again, CPC is merely 0.84, which is close to well-known market top value 0.8. Note the red dashed lines, when MA(10) went below MA(200) that much, very often the market dived down. Therefore be alerted to this indicator.
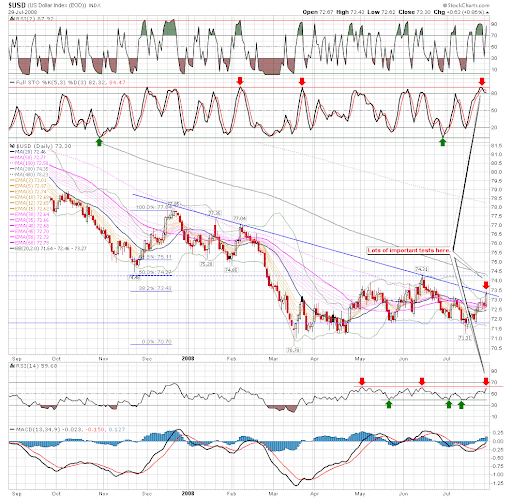
3.1.0 US Dollar Index (Daily). Today the US Dollar was quite bullish. Tomorrow it will be challenged, however.
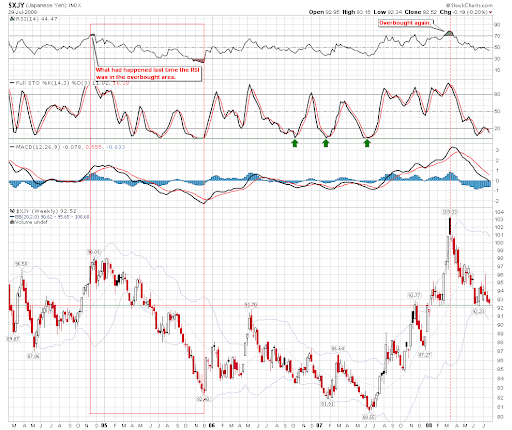
3.2.0 Japanese Yen (Daily). The Japanese Yen is sitting on a very important support. How important is the support? You may get it on the weekly chart 3.2.1 Japanese Yen (Weekly).
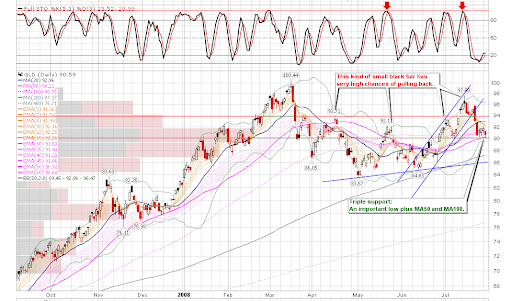
3.3.0 streetTRACKS Gold Trust Shares (GLD Daily). GLD is on the triple support.
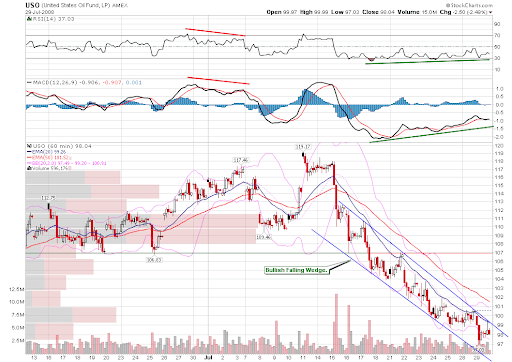
3.4.3 United States Oil Fund, LP (USO 60 min). It is still Bullish Falling Wedge, and both MACD and RSI show positive divergence.
As a summary to the inter-market conditions, tomorrow is the key. The rally of Yen and oil, if any, will be bearish to the stock market.
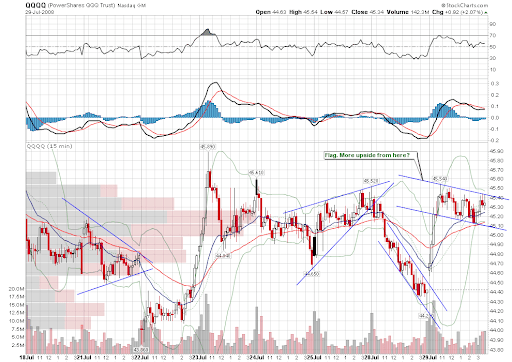
1.1.A PowerShares QQQ Trust (QQQQ 15 min). It looks like a Flag so at least tomorrow morning it may go further up.
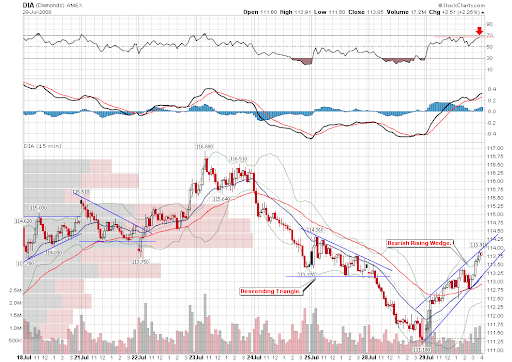
1.2.7 Diamonds (DIA 15 min). Here is a Bearish Rising Wedge. RSI doesn't look good.
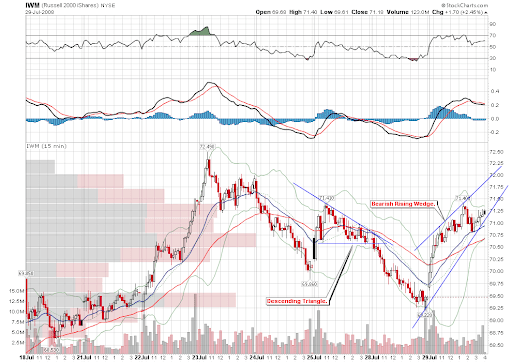
1.3.6 Russell 2000 iShares (IWM 15 min). Bearish Rising Wedge.
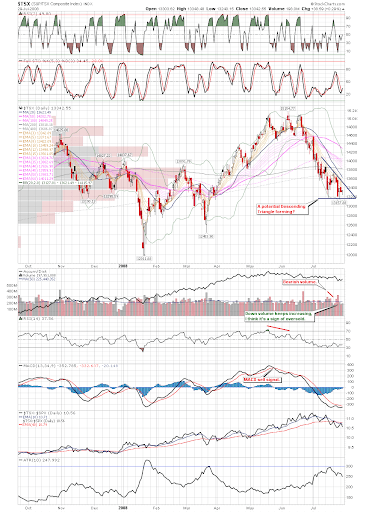
1.4.0 S&P/TSX Composite Index (Daily). The Canada market looks like a Descending Triangle pattern. Be cautious, it may break downward.
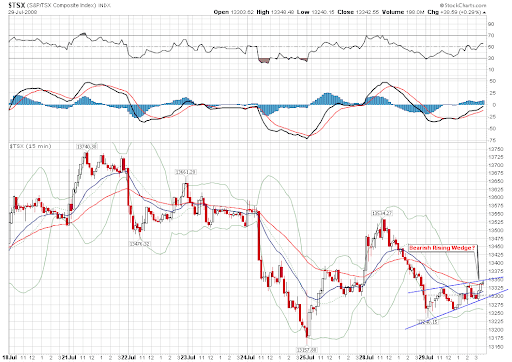
1.4.3 S&P/TSX Composite Index (15 min). On the 15-min chart the pattern is Bearish Rising Wedge, too.
Good work as usual but don't you think you are too cautious. First, that you did think the bottom was in, and now you think there is not much up side. Meanwhile the train has alredy left the station and gone 500 points. You now think all those falling wedges are bullish but it will take some time to materialise. Just jump onto to bull train and make some money. I used to use that many indicators like you and was never able to pull the trigger.
ReplyDelete2c
Thanks for the comment.
ReplyDeleteMaybe the title is misleading. "Not much upside" is for the short-term. The trigger pulled yesterday is for the mid-term and how far the mid-term will go, I have no idea.
I still see a pullback is due especially Nasdaq.
I put something on the stockcharts today, it's not about you. Someone sent me through stockcharts feedback said something. So I explained something there. Just let you know in case you think I didn't take your good advices well.
ReplyDeleteThanks again for the comment.
You do a great job with your market analysis. It is not possible to be 100% accurate but you do a good job keeping the odds in your favor at all times.
ReplyDeleteThe market is difficult right now for everyone; whether they are bull or bear and whether they rely on technical or fundamental analysis.
Your charts are very good and I look at them daily