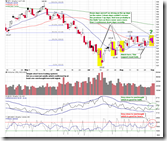
Today I would like to give you the conclusion first:
- As what I said before, if three down days cannot claim all the gain in the three up days, it means the up strength is stronger than the down strength. Today the market shows a little stronger up strength which is a good news. The market is still range bounded but at least it is not confirmed bearish.
- If SPX has three down days in a row, I said that on the fourth day we will see a rebound. So tomorrow the market might go up according to this observation. However, besides this reason there is no other evidence to support the suspected rebound. I don't know how the market will resolve this puzzle, maybe a simple explanation is an overbought market can become even more overbought. Well, if the market indeed rises I think it's better to close a part of long positions since the market has been overbought already.
0.0.1 Simple SPY Trading System. Above conclusions can be seen on this chart. Keep an eye on NYADV at the bottom. If it rises tomorrow, it may get overbought and the bounce (if we ever see one) could be a one-day wonder.
1.1.A PowerShares QQQ Trust (QQQQ 15 min). MACD and RSI show positive divergence. QQQQ probably has a chance to bounce back tomorrow.
1.1.4 Semiconductor Holders (SMH Daily). This chart supports the possible rebound of QQQQ as well. The oversold SMH is the primary reason why Nasdaq is so weak recently. On the chart you can see that it had rallied 9 days continuously... finally it turned to oversold from extremely overbought.
5.3.0 Financials Select Sector SPDR (XLF Daily). Look at this chart, XLF has rallied for 6 six days and this never happened before. I feel reluctant to say it is overbought and due for a pullback tomorrow. But in term of probability the pullback will happen for sure. I don't know if XLF can help the broad market to rally. If it pulls back, how can the whole market rally?
3.1.0 US Dollar Index (Daily). The Doji (i.e., the cross) candlestick pattern looks very toppy. Tomorrow it should go down a bit, which is bearish to the stock market.
3.4.1 United States Oil Fund, LP (USO Daily), oversold and at the support. Two red hollow candles, high probability of reversal. Will the stock market still go up?
5.2.0 Energy Select Sector SPDR (XLE Daily), oversold. Yesterday I said it never drops longer than three days recently, well, today is the fourth down day. So no pattern is absolutely accurate. Anyway, the volume still looks a capitulation so I believe it will bounce back soon. As I said yesterday, the rebound of XLE is bearish to XLF, and in turn bearish to the broad market.
As a summary, although I really wish the market could rally tomorrow, I cannot find any strong evidence. Maybe aforementioned indicators might not have an accurate timing and might keep as it is for a while. This gives me a feeling that, the rally tomorrow -- if we can ever see one -- seems not sustainable and might be farfetched. I do not deny the possibility of rally but I do not feel optimistic to the post-rally days either.
Just for your information, today actually there is a mid-term bottom signal. Because the present inflation rate is quite high (the data from the government denies it though), the trend of bond is not necessarily the opposite to the stock market. As a result, I doubt its applicability. 3.0.0 10Y T-Bill Yield, note that the green dashed line accurately pinpoints the bottoms of the stock market, which is shown by the pale green line in the background. Does it mean we are going to see a massive rally? For the validation of this signal, you may refer to 8.0.4 Market top/bottom by ROC30 of 10Y T-Bill Yield 2005-2008, 8.0.5 Market top/bottom by ROC30 of 10Y T-Bill Yield 2001-2004. Note that the validation was done in a low-inflation history, which is different from the current situation.
1.4.4 TSE McClellan Oscillator. Note the green circles at the bottom of the chart. The Canadian market is oversold. Of course, RHTSX can stay at zero for some time. However, if the oil and the energy sector are going to bounce back according to aforementioned analysis, the Canadian market will have a chance, too.


Cobra,
ReplyDeleteAlthough many people believe that inflation is higher than the published numbers, there's also a case for house prices to be factored into the 'basket' analysis for inflation. Interestingly, under that scenario, US inflation is even lower than the published figures.
Only time will tell which measure is more accurate, but I just thought I'd mention it in case you hadn't heard of this before.
I love your blog. Thanks so much for blogging for us all!
John
Thanks John, that's quite useful info, I'll remember that.
ReplyDelete