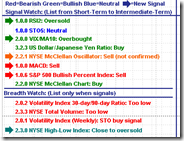
Conclusion today:
- There are a few mid-term sell signals, especially 1.0.6 S&P 500 Bullish Percent Index, all three major indices confirm the sell signal at the same time. Therefore it is very likely the down leg begins, and the target is at least the low in July.
- We also get a few short-term oversold signals so the probability of market rebound is high. On the other hand, no signal clearly indicates that the market will bounce back tomorrow.
0.0.0 Signal Watch and Daily Highlights contains all the signals. Read it and you will know what kind of situation the market is at present.
Firstly let's take a look at the evidence to prove the mid-term trend is bearish.
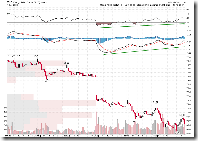
1.0.7 S&P 500 Large Cap Index (Major Accum/Dist Days). This is the main topic today, Major Distribution Day. The theory is that it does not appear in single. In a few weeks we will see another one unless a Major Accumulation Day happens before it.
2.4.2 NYSE - Issues Advancing. This chart is not very easy to read, basically you just pay attention to the Divergence. Look at the pale gray line, it usually forms a series of higher low before the market approaches a bottom. Now we have the first lower low, which means the trend of SPX will keep going down before a series of higher low shows up.
1.0.6 S&P 500 Bullish Percent Index. As I said before, the sell signal is confirmed.
As a summary, all above signals mean the market will be quite weak from now on.
Next let's take a look which signals are supporting a short-term rebound.
1.0.4 S&P 500 SPDRs (SPY 15 min). This is why I am not sure if the market will bounce back tomorrow, i.e., the positive divergence on MACD and RSI is to short to firmly support the rebound. Compare with 1.4.3 S&P/TSX Composite Index (15 min) you will see even if the divergence becomes very significant, a rebound may still not show up. By the way, according to 1.4.3, I think Canadian market may likely bounce back.
2.0.0 Volatility Index - NYSE (Daily). Besides the famous MA10 ENV is broken upward significantly, STO is also testing the resistance. Therefore it may reverse in the short-term, which means the market might bounce back.
1.1.6 PowerShares QQQ Trust (QQQQ Daily), oversold, and STO is on the support level too. Thus it has a chance to bounce back.
1.1.C TRINQ Trading Setup, TRINQ is greater than 2 today. Therefore QQQQ might bounce back tomorrow according to the TRINQ pattern. However, be reminded that the success rate of TRINQ setup is about 61%.
2.3.0 NYSE High-Low Index, this is the hope in the next Monday. If it keeps going down tomorrow, it may get oversold and the market will have a better chance to bounce back on the next Monday.
As a summary, in the short term bulls can hope for rebound but it may not happen tomorrow.
As what I said yesterday, I am not clear how the market will solve the issue of the short-term pullback of US dollar. Today the market tanked while US dollar raised like crazy. Once US dollar pulls back, what will happen? I am not optimistic.
3.1.0 US Dollar Index (Daily), overbought. The negative divergence still exists in the indicators.
3.2.0 Japanese Yen (Daily). The chart of Japanese Yen looks bullish, Breakout Ascending Triangle. Of course, it is overbought too. Besides RSI2 is extremely overbought, RSI14 is also testing the resistance, so in the short-term it may pull back. Then the stock market may not look too bad if US dollar pulls back at the same time, hopefully.
3.4.1 United States Oil Fund, LP (USO Daily), oil is still oversold and holds on the support.
5.2.0 Energy Select Sector SPDR (XLE Daily). XLE may help the market bounce back. It is oversold and the volume still looks like a typical capitulation to me. It should probably bounce back.
5.2.2 Energy Select Sector SPDR (XLE 15 min). The positive divergence on MACD and RSI is actually fairly powerful.
If oil bounces back, so should be the Canadian market. 1.4.0 S&P/TSX Composite Index (Daily), oversold. 1.4.3 S&P/TSX Composite Index (15 min), as I said before the positive divergence on MACD and RSI is very significant. The Canadian market index dropped almost 1000 points within 3 days, how crazy it is.


0 comments:
Post a Comment