Firstly I would like to give my two cents on whether the big money were dumping their positions in recent two weeks.
If the big money wanted to distribute, the bailout news should be a perfect chance to pump the market up. This is because the majority of the retail traders considered the bailout plan as positive till yesterday, and they would believe the rally in the past two weeks was real. My question is, why the market was hammered down in the past two weeks? Doesn't big money want to distribute at a high price level? The market plummeted so retail traders were trapped, and then big moneys could hammer down the market even further? Tell me, which way is more profitable for distribution of existing long positions? So far what had happened this year were the same patterns, for whatever positive news from the government, the market was pushed up before the news was released. This is so called buy on rumor, sell on news. Friday the market was sell on news. However there was no buy on rumor as far as I remember. Someone might say, INDU did rally for 300 plus points prior to the vote on Friday and that could be counted as pump and distribute. Come on, big moneys cannot sell that quickly like retail traders. Therefore I think there are two possible explanations to the selling off:
- Big moneys are getting a tremendous trouble and selling at any price;
- Big money intentionally accumulated more positions at a low level.
Which one is more likely? I don't know, period. End of conspiracy theory.
Okay, back to market analysis. Here is the conclusion:
The mid-term outlook is bullish, but I am not sure if there will be a big selling off in the near term. Monday, I think the probability of bouncing back up is very high, and the main reason is that the market is extremely oversold. Some readers may be waiting for my complaint -- maybe the oversold indicators won't work this time, and the market will probably go down to zero -- not yet.
0.0.4 SPX Sell Climax. In the evening of Thursday, a reader asked why we didn't see a three down days in a row prior to a bottom? Okay, here we go! According to this chart, any three consecutive down days could possibly be a bottom. Pay attention to the volume pattern, if the price is down on increased volume, and the oversold will be more obvious, as a result it will be more likely that the market is bottomed. Now we have seen three down days with this volume pattern.
1.3.7 Russell 3000 Dominant Price-Volume Relationships. Price down volume up for two days, oversold. Note the green comments, what happened on the next day when the market was oversold similarly? Now we have seen two such days, which happens the first time on the chart.
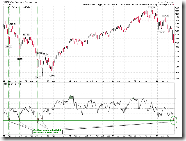
The following chart shows the relationship between weekly SPX and RSI. An oversold RSI on the weekly chart is extremely rare. It happened three times during the 2000 bear market, where the market went afterward?
Look at the green curve on T2107, NYSE percent of stocks above MA200 is almost the lowest on the record.
2.4.3 Breadth Oversold/Overbought Watch. All indicators on the chart are extremely oversold.
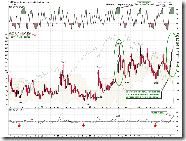
2.0.1 Volatility Index (Weekly). VIX has rallied for six weeks and this is the second time in the history.
1.1.0 Nasdaq Composite (Daily). NAMO at the bottom was oversold. By the way, prediction by the oversold NAMO has been quite accurate in the past.
1.1.6 QQQQ Short-term Trading Signals, bullish falling wedge, and STO at the top of the chart is at the support level. Furthermore there are a few other oversold indicators. The green dashed lines denote the locations where NAADV was oversold.
1.0.3 S&P 500 SPDRs (SPY 60 min), 1.1.4 PowerShares QQQ Trust (QQQQ 60 min), 1.2.3 Diamonds (DIA 60 min), Bullish Falling Wedge, MACD, RSI positive divergence.
1.0.4 S&P 500 SPDRs (SPY 15 min), 1.1.5 PowerShares QQQ Trust (QQQQ 15 min), 1.2.4 Diamonds (DIA 15 min), Bullish Falling Wedge, RSI positive divergence.
As a summary, the market is extremely oversold at the moment, and I don't believe the oversold is sustainable for very long. In addition, all major indices show consistent bullish pattern on daily, 60 min and 15 min charts. Therefore, at least the probability of rally in the short term is very high, in my opinion,.
5.0.2 S&P Sector Bullish Percent Index. Take a look at the Bullish Percent Index of a few important sectors, they are very close to the record low, aren't they? No further comments.


The bounce will be triggered by an international rate cut parade next week. The Bank of England is poised to cut a half percent and the ECB will likely cut at least a quarter percent.
ReplyDeleteThanks. Hope you're right.
ReplyDelete